Fig. 24
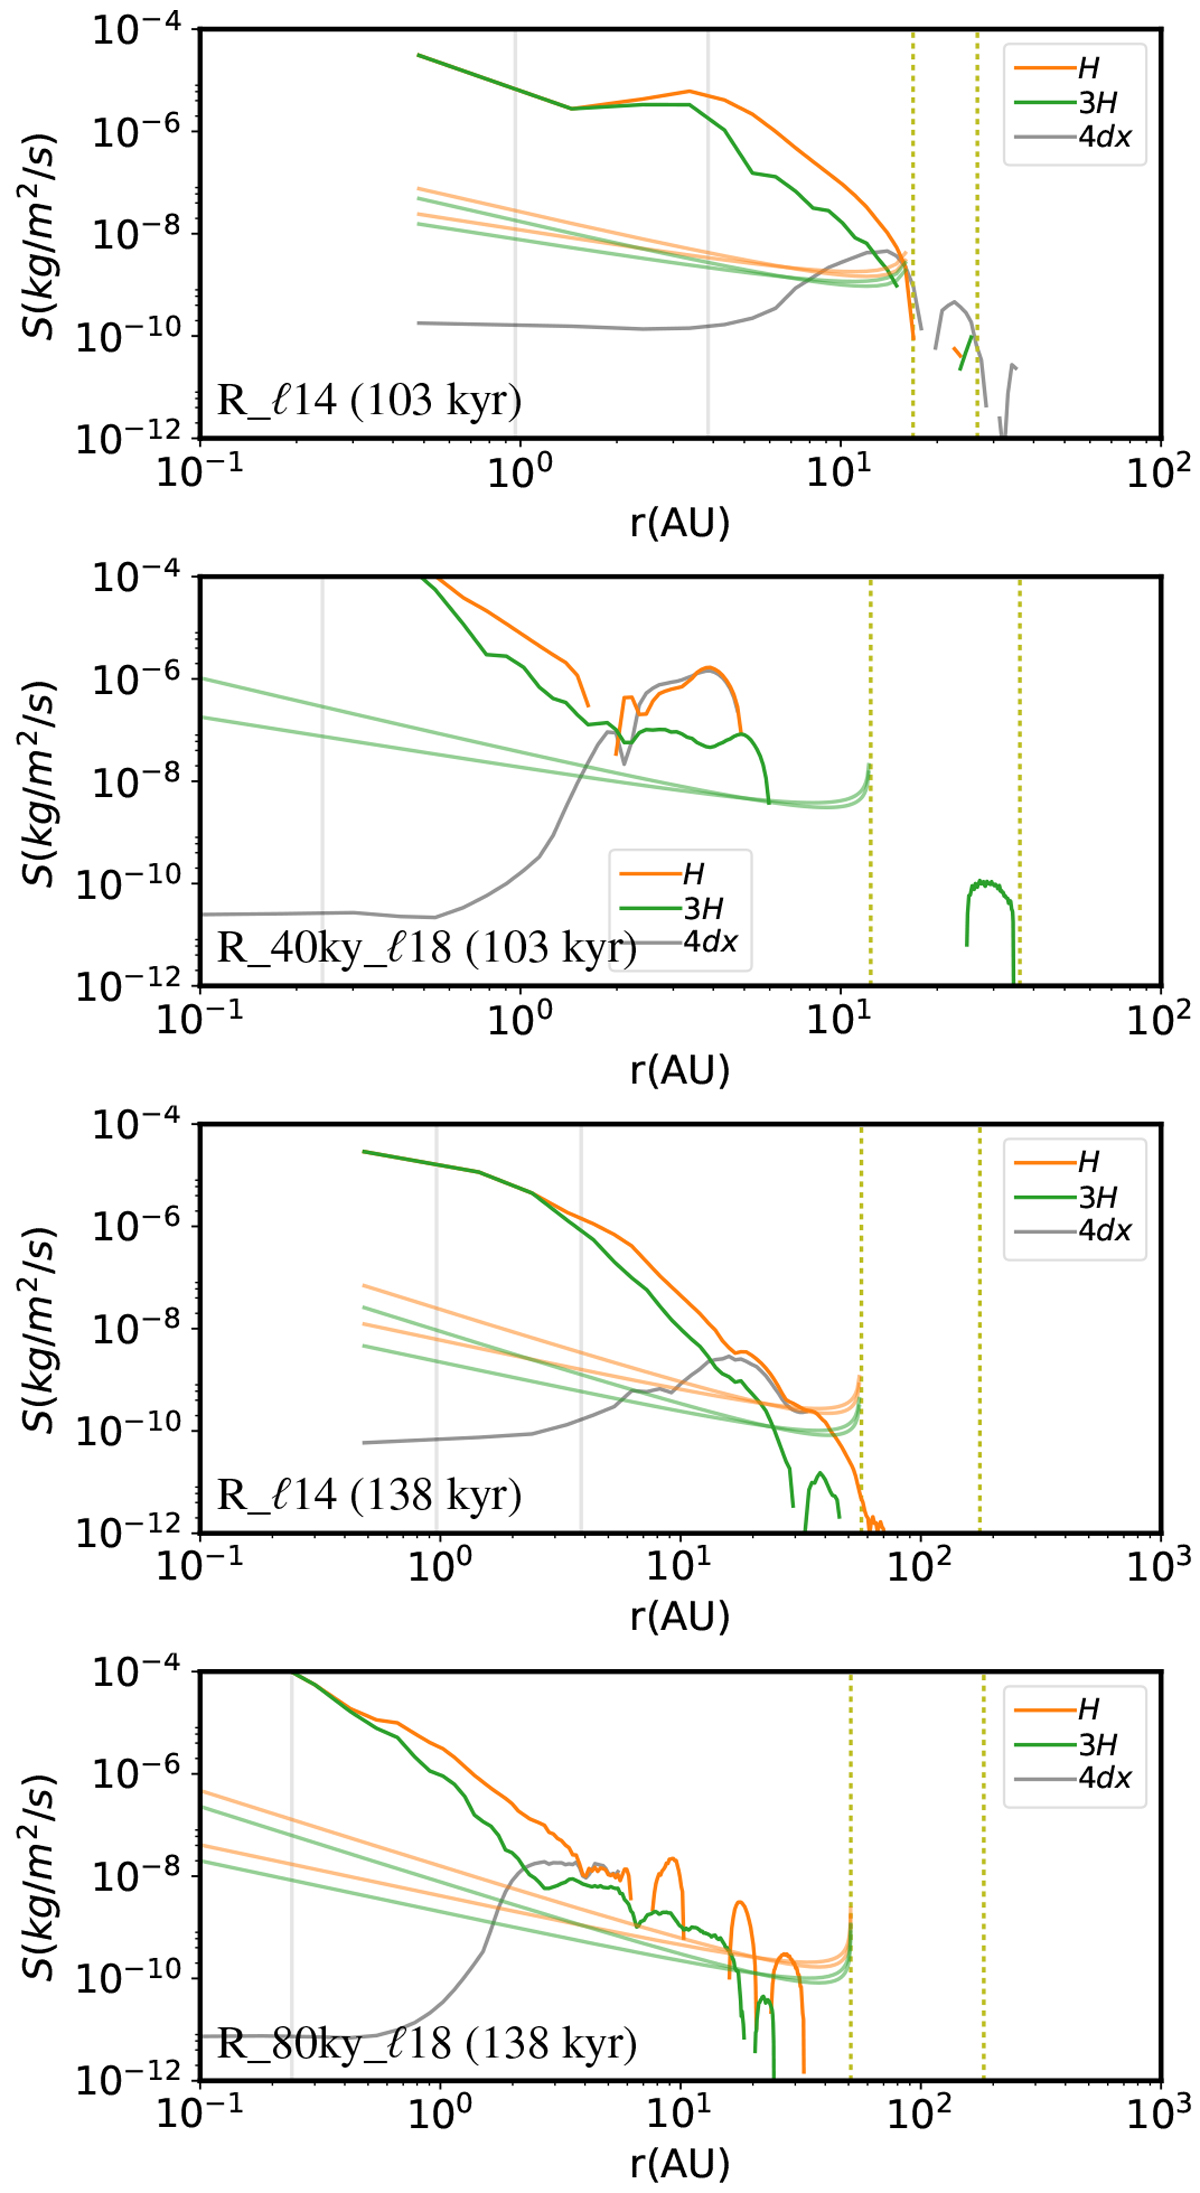
Source function S(r) measured at H (orange) and3H (green) in R_ℓ14 and R_40ky_ℓ18 at 103 ky, R_ℓ14 and R_80ky_ℓ18 at 138 ky (from top to bottom). The flux measured at the horizontal plane z = 4d x is shown in gray. The curves in lighter colors are the analytical functions from pure hydrodynamic predictions that have the same amount of total flux (see Fig. 3). The source function measured in the simulations is much steeper than that of the classical model, and strong infall occurs in the central part of the disk. At a given radius, the flux is generally greater at lower altitudes, indicating that there is a strong radial flux in the interior of the disk. At small radii (below the sink accretion radius), the measured flux at H∕3H is no longer realistic, and we used the measurement at z = 4dx to calculate the total flux.
Current usage metrics show cumulative count of Article Views (full-text article views including HTML views, PDF and ePub downloads, according to the available data) and Abstracts Views on Vision4Press platform.
Data correspond to usage on the plateform after 2015. The current usage metrics is available 48-96 hours after online publication and is updated daily on week days.
Initial download of the metrics may take a while.