Fig. 6.
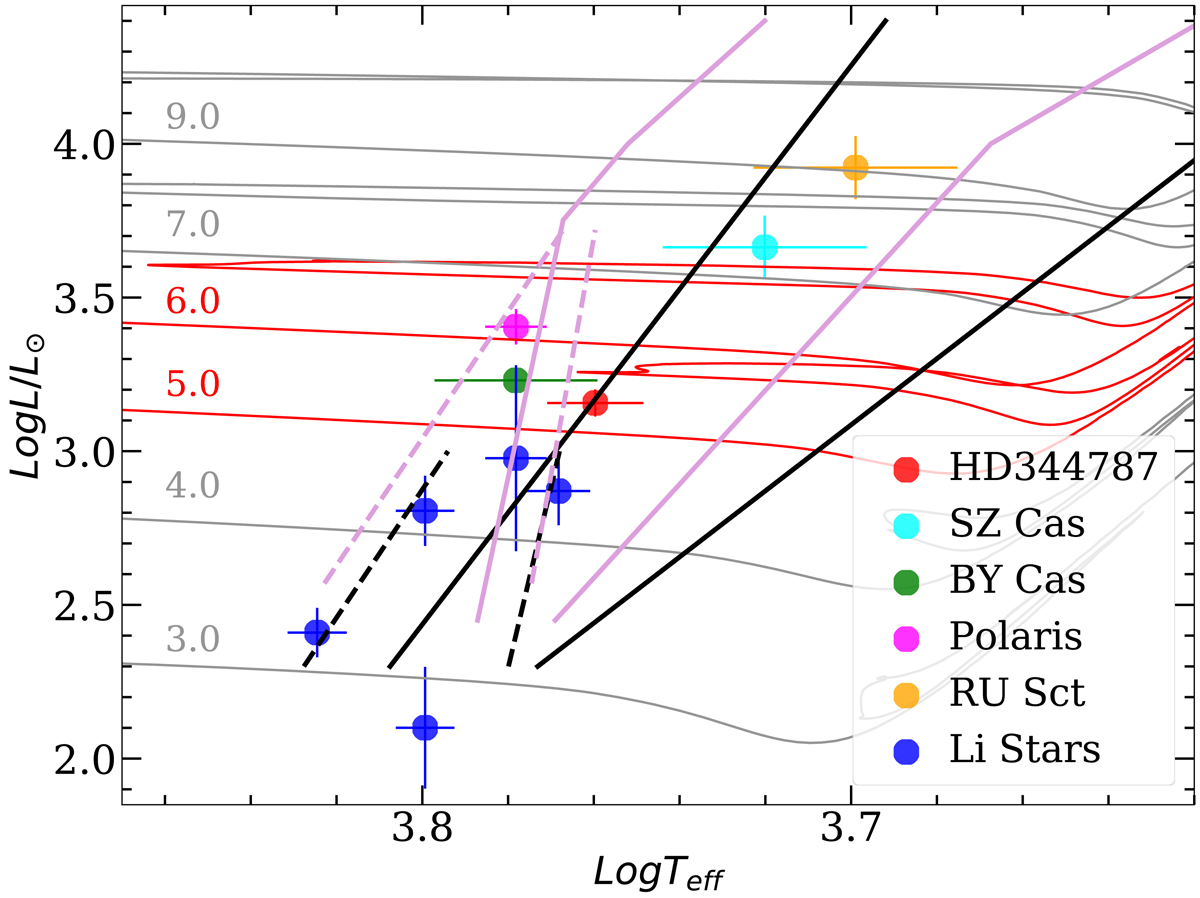
HR diagram of HD 344787 and Polaris together with the other candidate first-crossing DCEPs (see labels). The figure also reports MW Li-rich DCEPs from Catanzaro et al. (2020). The ISs for F (solid lines) and FO (dashed lines) DCEPs are over-plotted in black for Z = 0.02 (De Somma et al. 2020) and in light violet for Z = 0.008 (Bono et al. 2001). The evolutionary tracks by Bressan et al. (2012) with Z = 0.014 and Y = 0.273 for 5 and 6 M⊙, encompassing the location of Polaris and HD 344787 in the HRD, are displayed in red. Additional tracks for 3, 4, 7, and 9 M⊙ are over-plotted on the data in grey.
Current usage metrics show cumulative count of Article Views (full-text article views including HTML views, PDF and ePub downloads, according to the available data) and Abstracts Views on Vision4Press platform.
Data correspond to usage on the plateform after 2015. The current usage metrics is available 48-96 hours after online publication and is updated daily on week days.
Initial download of the metrics may take a while.