Free Access
Fig. 1.
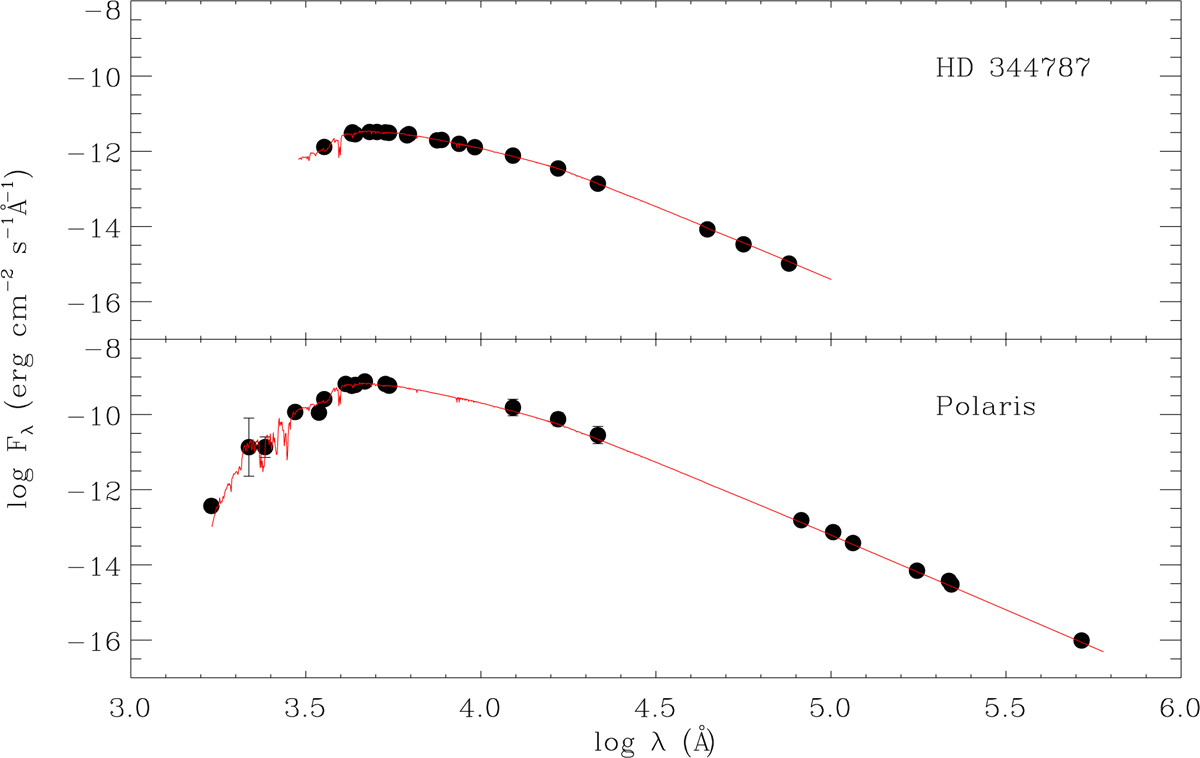
Spectral energy distribution of HD 344787 (upper panel) and Polaris (bottom panel). Filled dots represent the observed fluxes as retrieved from the VOSA tool. The red line shows the theoretical flux computed using the ATLAS9 code.
Current usage metrics show cumulative count of Article Views (full-text article views including HTML views, PDF and ePub downloads, according to the available data) and Abstracts Views on Vision4Press platform.
Data correspond to usage on the plateform after 2015. The current usage metrics is available 48-96 hours after online publication and is updated daily on week days.
Initial download of the metrics may take a while.