Fig. 3.
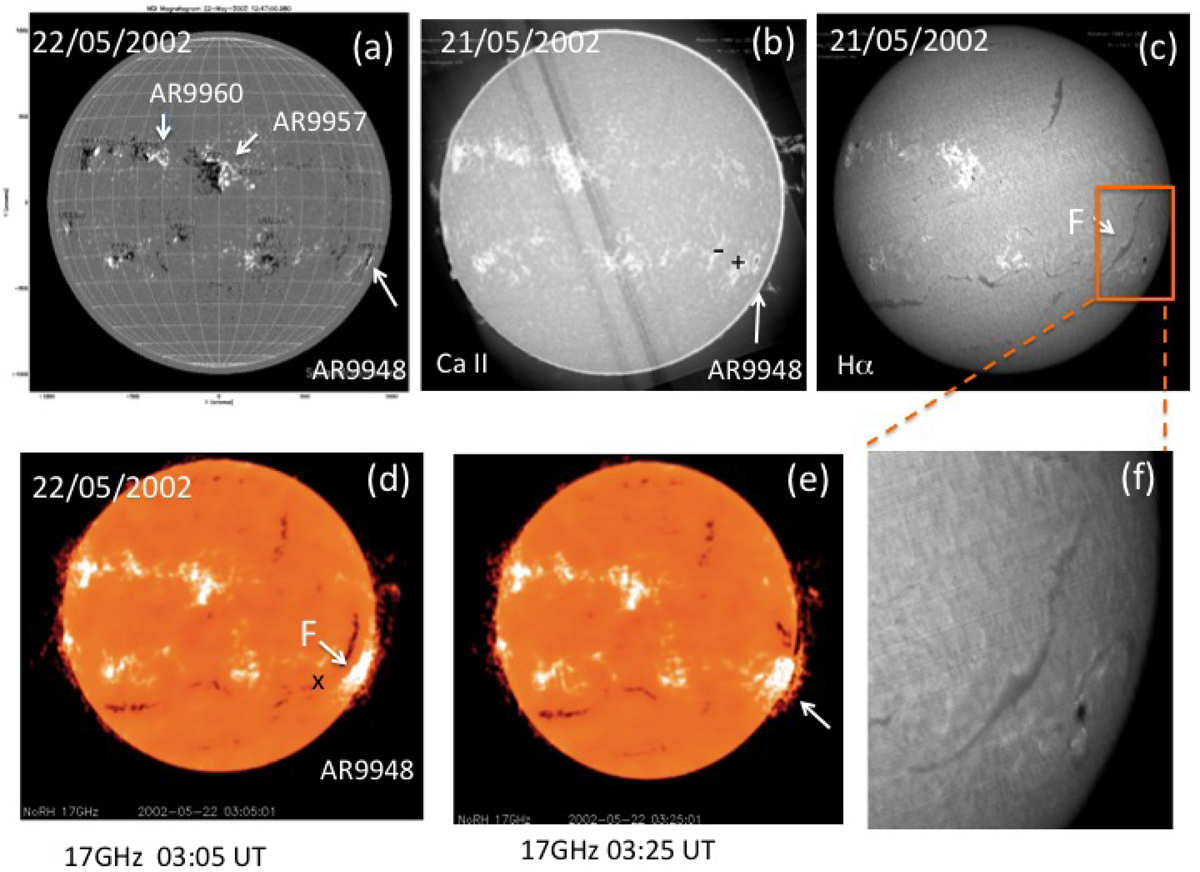
Solar disk observations. (a): longitudinal magnetic field from MDI on May 22 with the active region (AR) numbers. (b) and (c): Meudon spectroheliogram observations in Ca II and Hα, respectively, showing the long filament (F) in the west in Hα. (d) and (e): radio images in 17 GHz obtained in Nobeyama showing the filament eruption between 03:05 and 3:25 UTC. (f): zoom in Hα on the filament and AR 9948.
Current usage metrics show cumulative count of Article Views (full-text article views including HTML views, PDF and ePub downloads, according to the available data) and Abstracts Views on Vision4Press platform.
Data correspond to usage on the plateform after 2015. The current usage metrics is available 48-96 hours after online publication and is updated daily on week days.
Initial download of the metrics may take a while.