Fig. 4
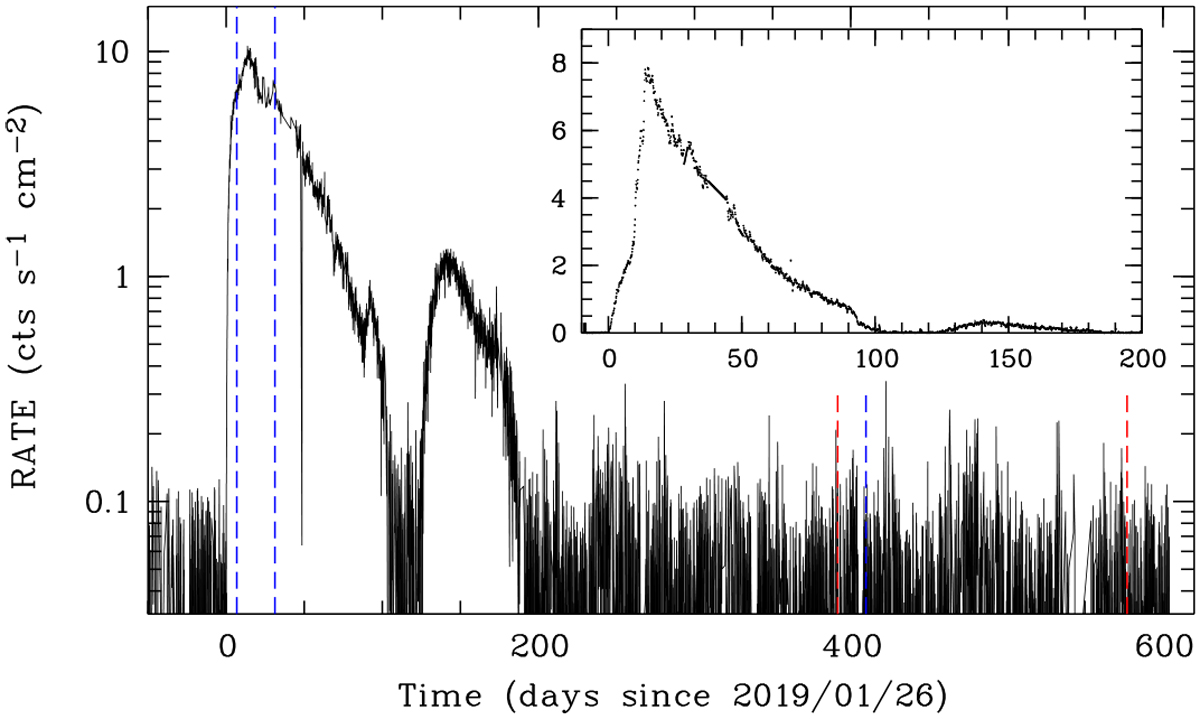
MAXI light curve in the 2–20 keV band. Dashed blue lines indicate XMM-Newton observations (0831000101: 26 ksec, 0831000301: 15 ksec, 0870590101: 77 ksec), dashed red lines eRASS1 and eRASS2 observations. The inset shows the MAXI light curve in the 2–3 keV band in linear representation, binned in 0.1 d intervals and interpolated in periods of missing data.
Current usage metrics show cumulative count of Article Views (full-text article views including HTML views, PDF and ePub downloads, according to the available data) and Abstracts Views on Vision4Press platform.
Data correspond to usage on the plateform after 2015. The current usage metrics is available 48-96 hours after online publication and is updated daily on week days.
Initial download of the metrics may take a while.