Fig. 3.
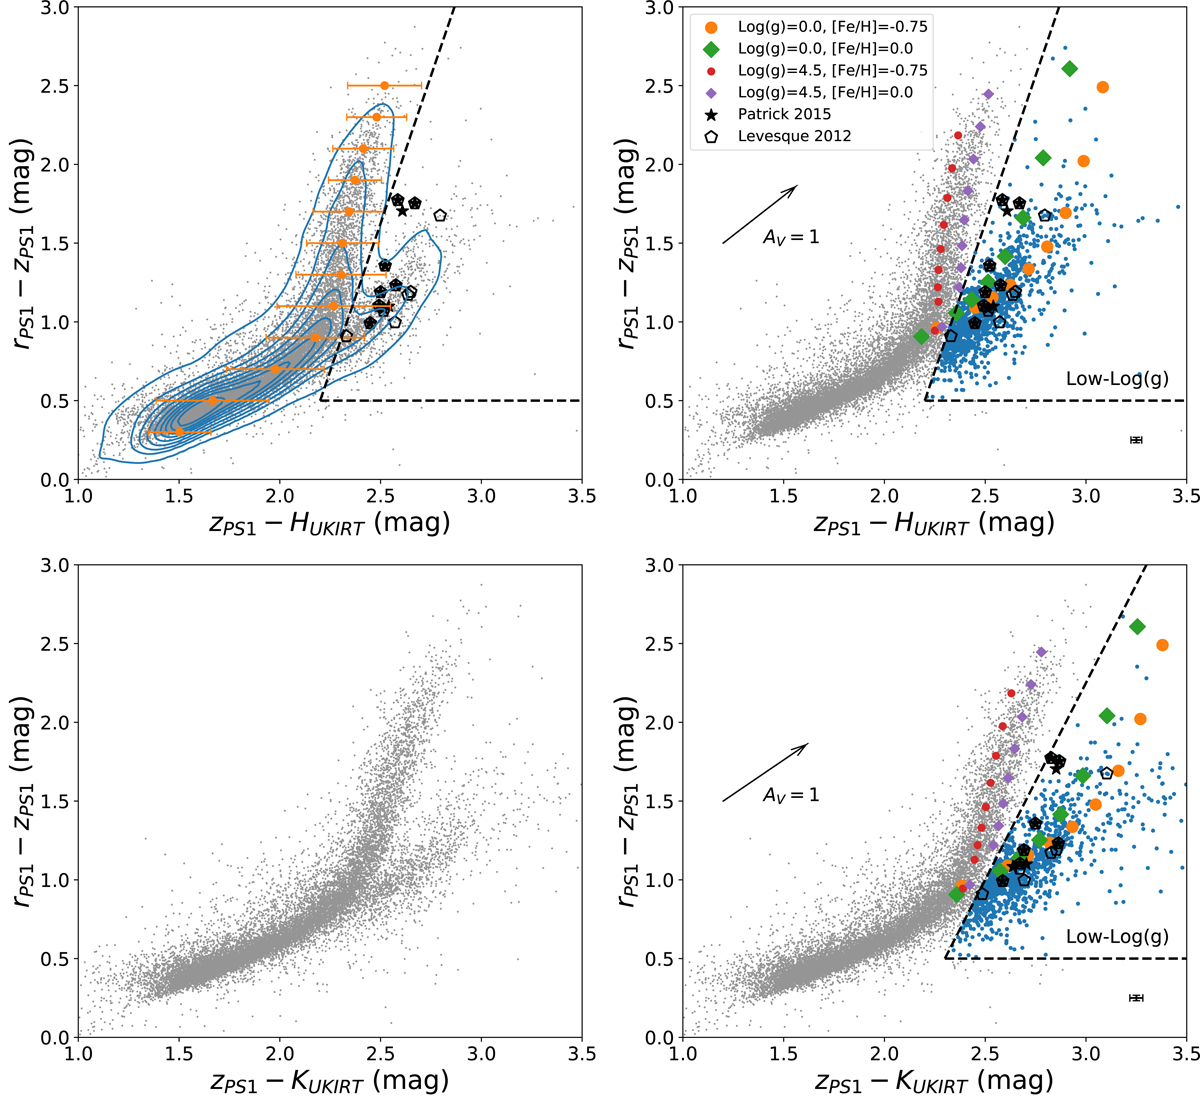
Color–color diagrams of z − H vs. r − z (upper) and z − K vs. r − z (bottom). Upper left panel: examples of KDE (contours) and MAD (solid circles indicate the median values of z − H color in equal bins (from 0.3 to 2.6 with a step of 0.2 mag) of the r − z color, and the error bars indicate three times of MAD for the corresponding bin), both of which fail to include all the spectroscopically confirmed RSGs. Left panels: original data without the overlapping MARCS models, right panels: MARCS-model selected LSG region (dashed lines are hand-drawn). Small and large solid circles and diamonds represent HSG and LSG targets at different Teff (from 3300 to 4250 K) in different metallicities derived from MARCS models, respectively. Spectroscopically confirmed RSGs from Levesque & Massey (2012) and Patrick et al. (2015) are shown as open pentagon and solid stars, respectively. A reddening vector of AV = 1.0 mag is shown as a reference (same below). The error bars in the bottom right corner of the right panels indicate the median error of each color.
Current usage metrics show cumulative count of Article Views (full-text article views including HTML views, PDF and ePub downloads, according to the available data) and Abstracts Views on Vision4Press platform.
Data correspond to usage on the plateform after 2015. The current usage metrics is available 48-96 hours after online publication and is updated daily on week days.
Initial download of the metrics may take a while.