Open Access
Fig. 6
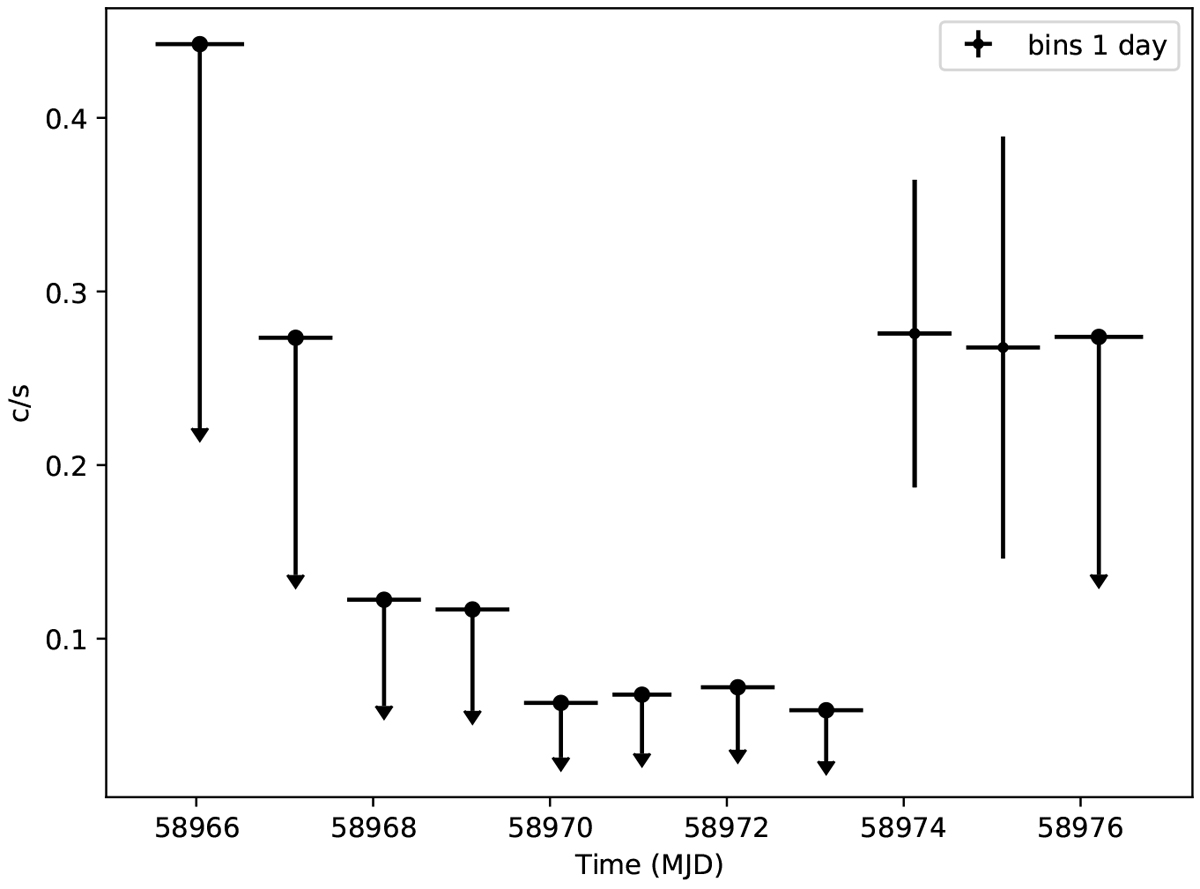
eRASS:1 light curve of XMMU J053108.3−690923 showing day-to-day variations of the source. Each bin includes six or seven scans of typically 30–40 s exposure. Count rates are normalised to 7 TMs. The upper limits correspond to 2σ detection.
Current usage metrics show cumulative count of Article Views (full-text article views including HTML views, PDF and ePub downloads, according to the available data) and Abstracts Views on Vision4Press platform.
Data correspond to usage on the plateform after 2015. The current usage metrics is available 48-96 hours after online publication and is updated daily on week days.
Initial download of the metrics may take a while.