Open Access
Fig. 1
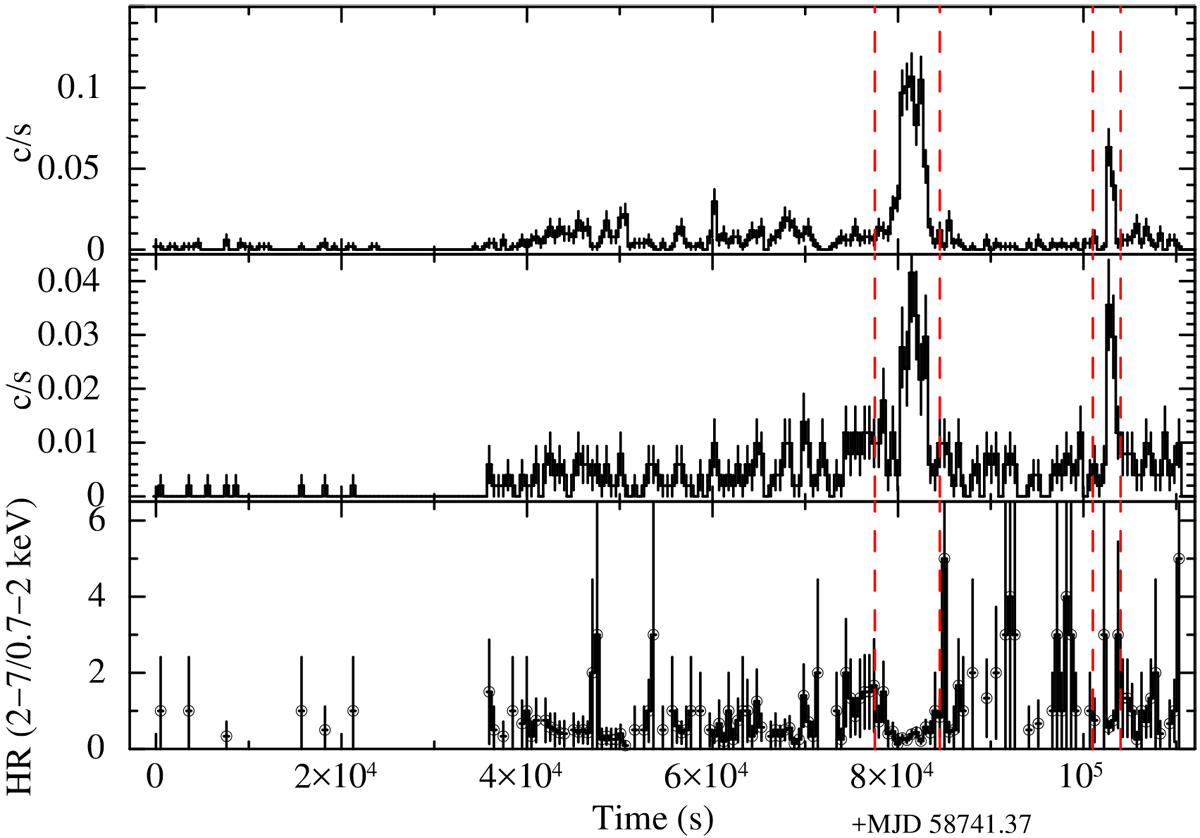
Combined eROSITA (TM3 and 4) light curve for Obs. 1 in two energy bands 0.7–2 keV (top) and 2.0–7.0 keV (middle) and the corresponding hardness ratio (bottom). Both light curves are binned with 506 s. The two flare intervals are marked with dashed vertical lines. Count rates are normalised to 7 TMs.
Current usage metrics show cumulative count of Article Views (full-text article views including HTML views, PDF and ePub downloads, according to the available data) and Abstracts Views on Vision4Press platform.
Data correspond to usage on the plateform after 2015. The current usage metrics is available 48-96 hours after online publication and is updated daily on week days.
Initial download of the metrics may take a while.