Fig. 5.
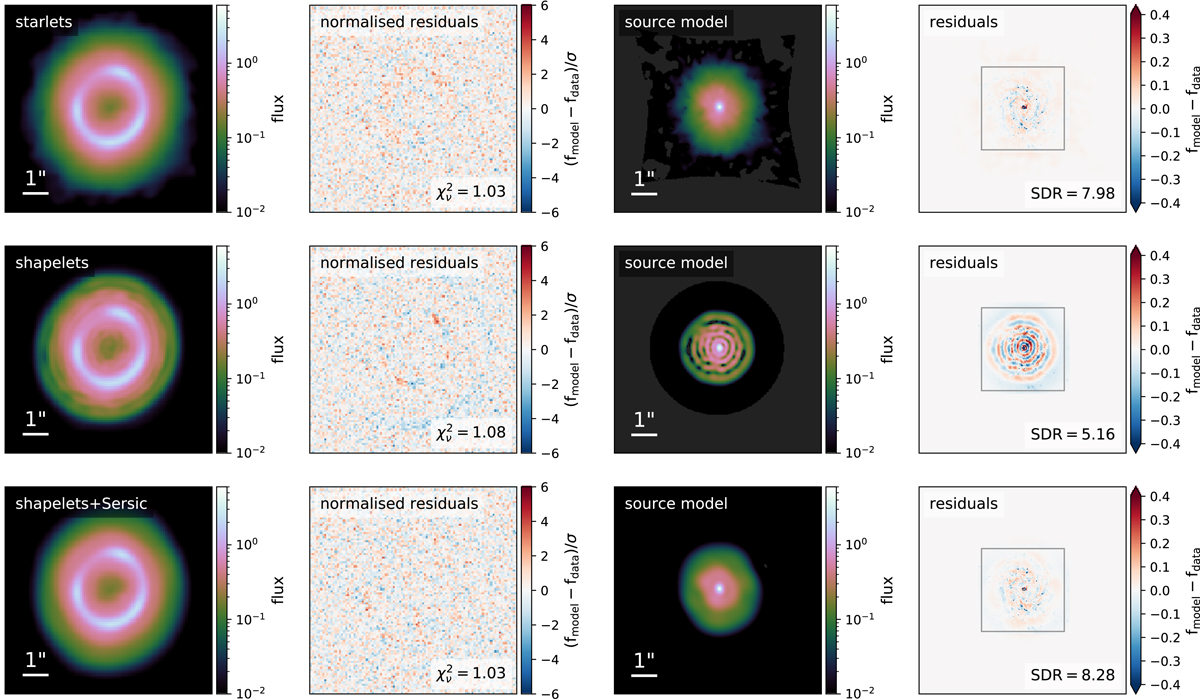
Source modelling of the simulated data with a single source galaxy (Fig. 4). Top to bottom: sparse model with starlets (rpix = 3), analytical model with shapelets (nmax = 18), analytical model with shapelets+Sérsic profile (nmax = 8). Left to right: image model, image normalised residuals and reduced chi-square, source model, source residuals and SDR. The SDR is computed only in the region indicated by the grey box, to avoid pixels with no flux to bias its value. All source reconstructions are shown at the supersampled resolution corresponding to the chosen rpix. Dark grey areas in model panels correspond to non-positive pixel values (which can be negative with shapelets, https://github.com/aymgal/SLITronomy-papers/blob/master/paper_I/mock_source_reconstruction.ipynb).
Current usage metrics show cumulative count of Article Views (full-text article views including HTML views, PDF and ePub downloads, according to the available data) and Abstracts Views on Vision4Press platform.
Data correspond to usage on the plateform after 2015. The current usage metrics is available 48-96 hours after online publication and is updated daily on week days.
Initial download of the metrics may take a while.