Fig. 10.
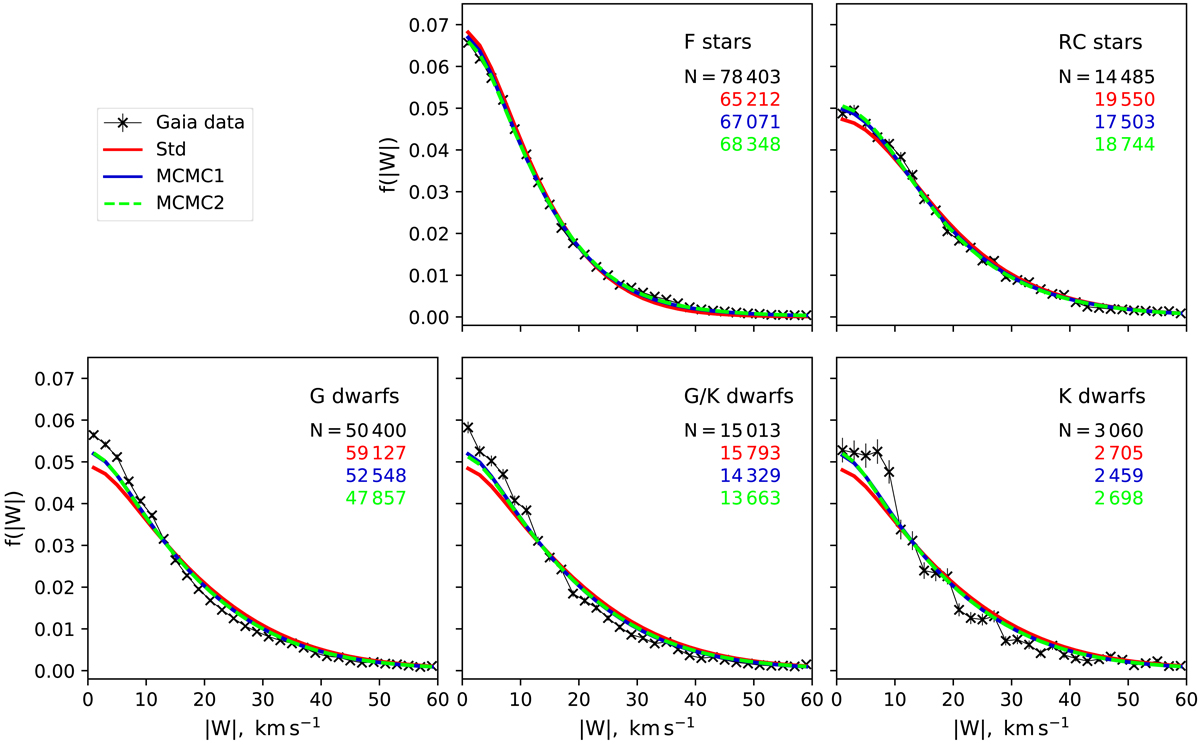
Observed and predicted functions for the five Gaia kinematic samples from Table 1. As in Fig. 9, the data are plotted with black crosses, and the three coloured curves correspond to the model predictions. The observed and modelled number of stars in each sample are also given with the same colour coding.
Current usage metrics show cumulative count of Article Views (full-text article views including HTML views, PDF and ePub downloads, according to the available data) and Abstracts Views on Vision4Press platform.
Data correspond to usage on the plateform after 2015. The current usage metrics is available 48-96 hours after online publication and is updated daily on week days.
Initial download of the metrics may take a while.