Fig. 20
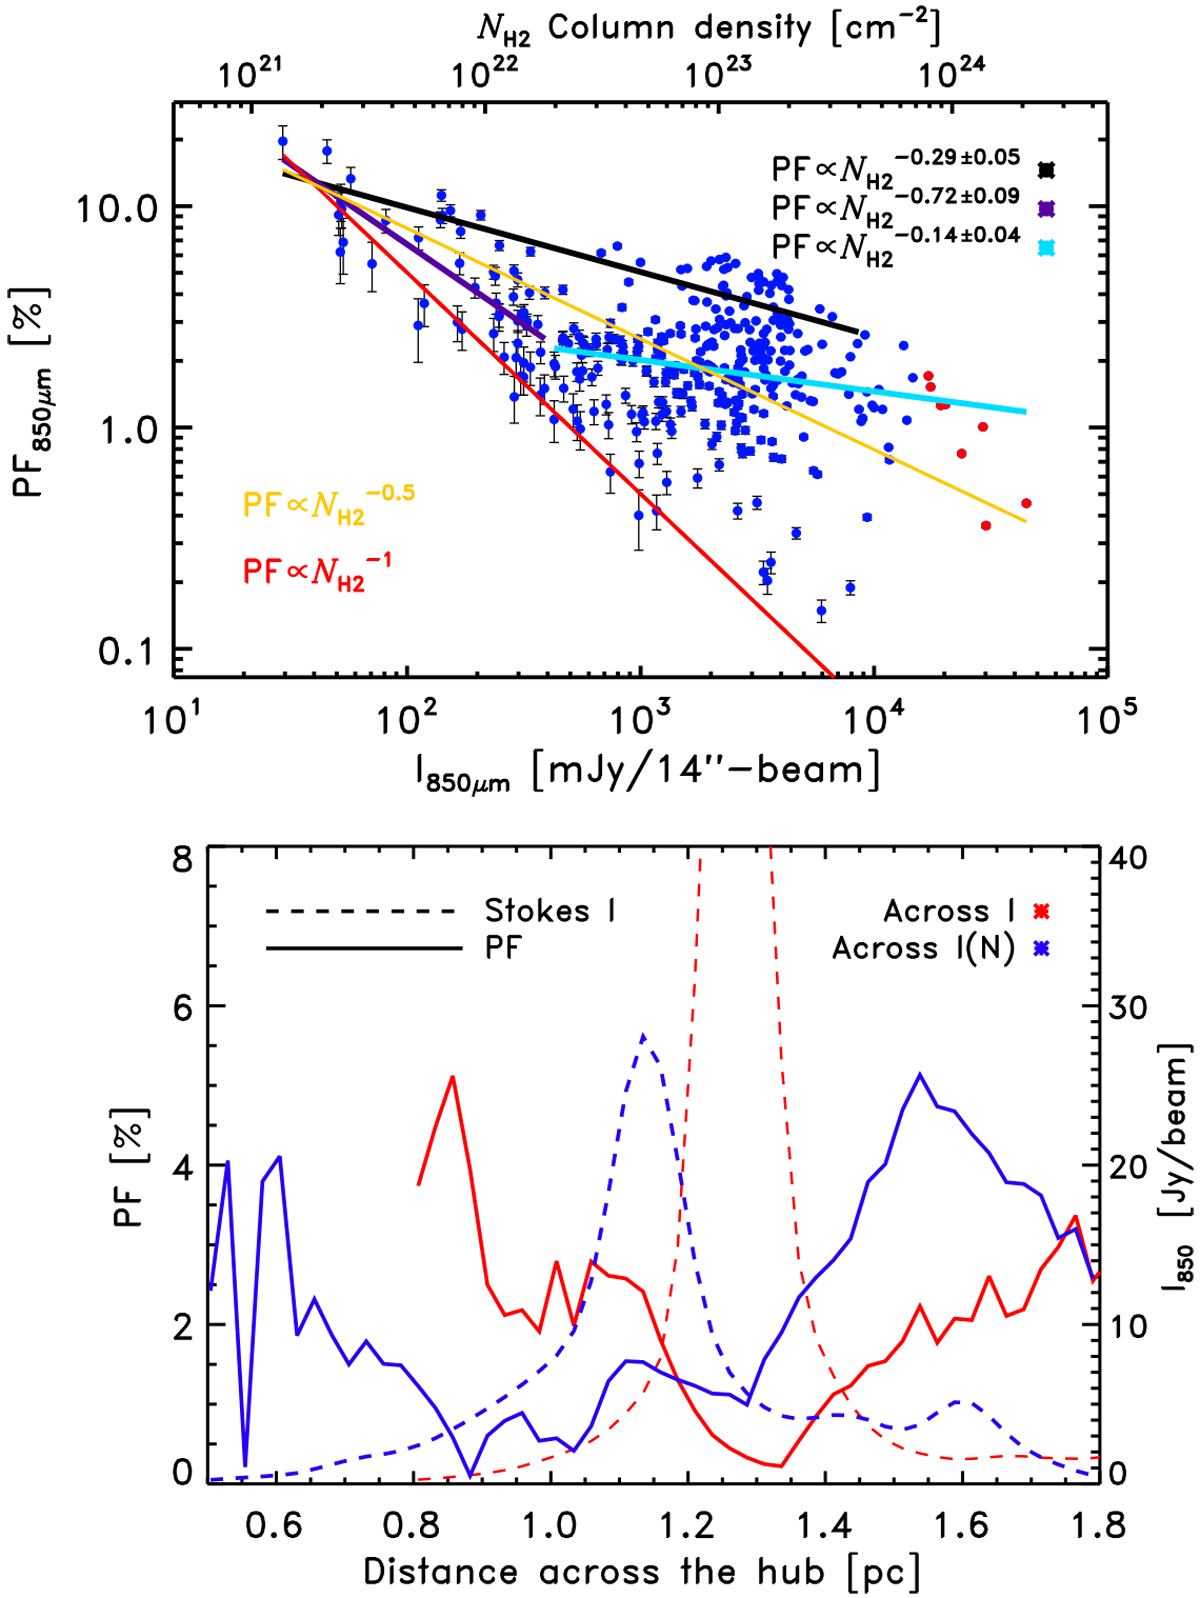
Properties observed toward the clump-hub (black dashed ellipse in Fig. 19). Top: PF as a function of I for SNR(I) > 25 and SNR(PI) > 3. The vertical small black lines show the statistical uncertainties on PF. The black, purple, and cyan lines indicate the best linear fits to the upper 95% percentiles of the distribution, the data points with ![]() , and the datapoints with
, and the datapoints with ![]() , respectively.The best fit slopes are indicated on the plot. For comparision, the yellow and red lines indicate slopes of
− 0.5 and − 1, respectively. Bottom: variation of PF (solid lines) and I
(dashed lines) for two horizontal cuts from east to west, crossing the star forming regions I and I(N) in red and blue, respectively. The peak in I
of the blue dashed profile at ~1.6 pc corresponds to the position of the ridge (crest 4).
, respectively.The best fit slopes are indicated on the plot. For comparision, the yellow and red lines indicate slopes of
− 0.5 and − 1, respectively. Bottom: variation of PF (solid lines) and I
(dashed lines) for two horizontal cuts from east to west, crossing the star forming regions I and I(N) in red and blue, respectively. The peak in I
of the blue dashed profile at ~1.6 pc corresponds to the position of the ridge (crest 4).
Current usage metrics show cumulative count of Article Views (full-text article views including HTML views, PDF and ePub downloads, according to the available data) and Abstracts Views on Vision4Press platform.
Data correspond to usage on the plateform after 2015. The current usage metrics is available 48-96 hours after online publication and is updated daily on week days.
Initial download of the metrics may take a while.