Fig. 10.
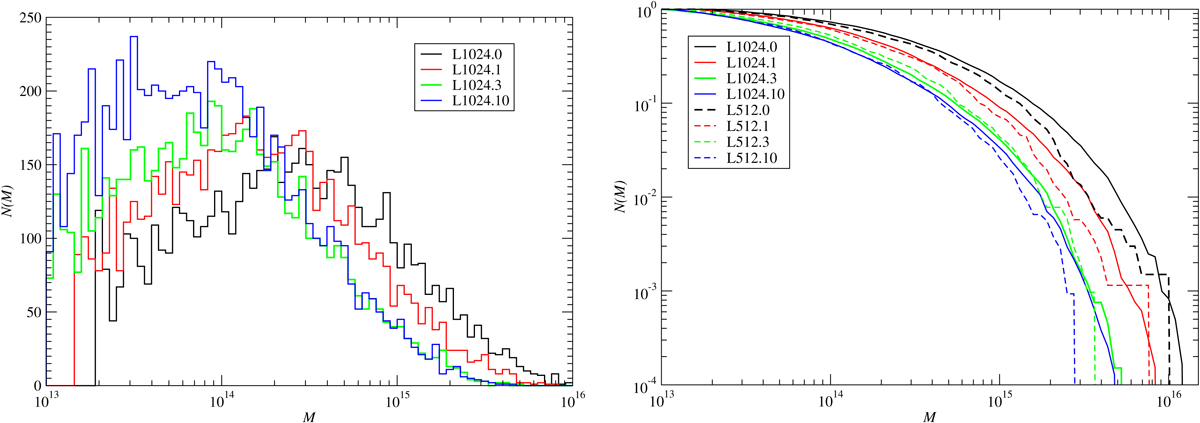
Evolution of supercluster masses of LCDM models. Left: distribution of supercluster masses of the LCDM model at various epochs. Right: cumulative distributions of supercluster masses of the LCDM models. For comparison we show the cumulative supercluster mass distribution for a ΛCDM model with side length L0 = 512 h−1 Mpc. Masses are given in solar units.
Current usage metrics show cumulative count of Article Views (full-text article views including HTML views, PDF and ePub downloads, according to the available data) and Abstracts Views on Vision4Press platform.
Data correspond to usage on the plateform after 2015. The current usage metrics is available 48-96 hours after online publication and is updated daily on week days.
Initial download of the metrics may take a while.