Fig. 14.
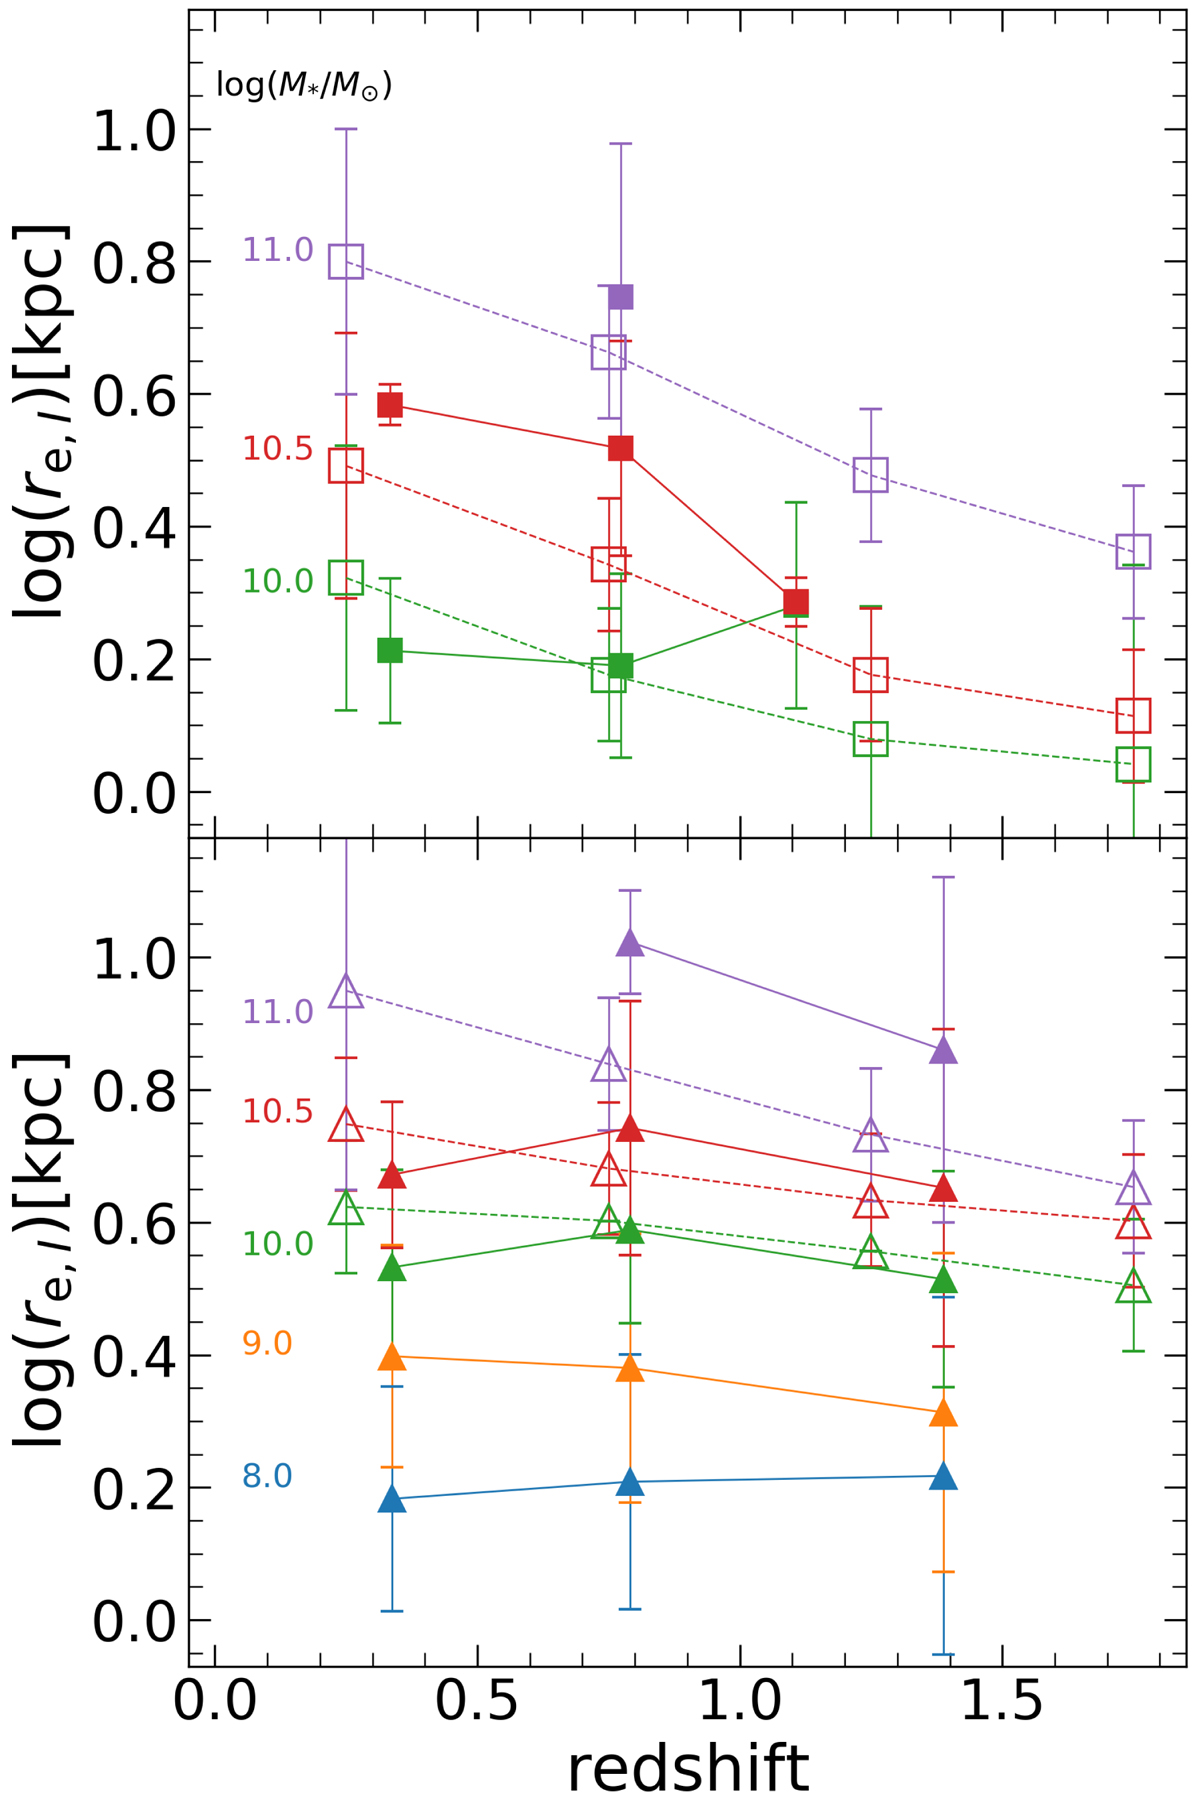
Median size evolution with redshift, the re − z relation. Median sizes are shown for fixed stellar mass bins centered at log M*/M⊙ = 8, 9, 10, 10.5, and 11 with colours indicated in the figure (bin width of 0.5 dex). We note that only three of the most massive bins are shown for ET for each volume (top panel). Filled symbols represent data from this work, while open markers shows data from Mowla et al. (2019), their Table 3 (including errors). Our error bars represent the median absolute deviation of the data in each bin. We plot median sizes for bins that have more than three sources.
Current usage metrics show cumulative count of Article Views (full-text article views including HTML views, PDF and ePub downloads, according to the available data) and Abstracts Views on Vision4Press platform.
Data correspond to usage on the plateform after 2015. The current usage metrics is available 48-96 hours after online publication and is updated daily on week days.
Initial download of the metrics may take a while.