Fig. 12.
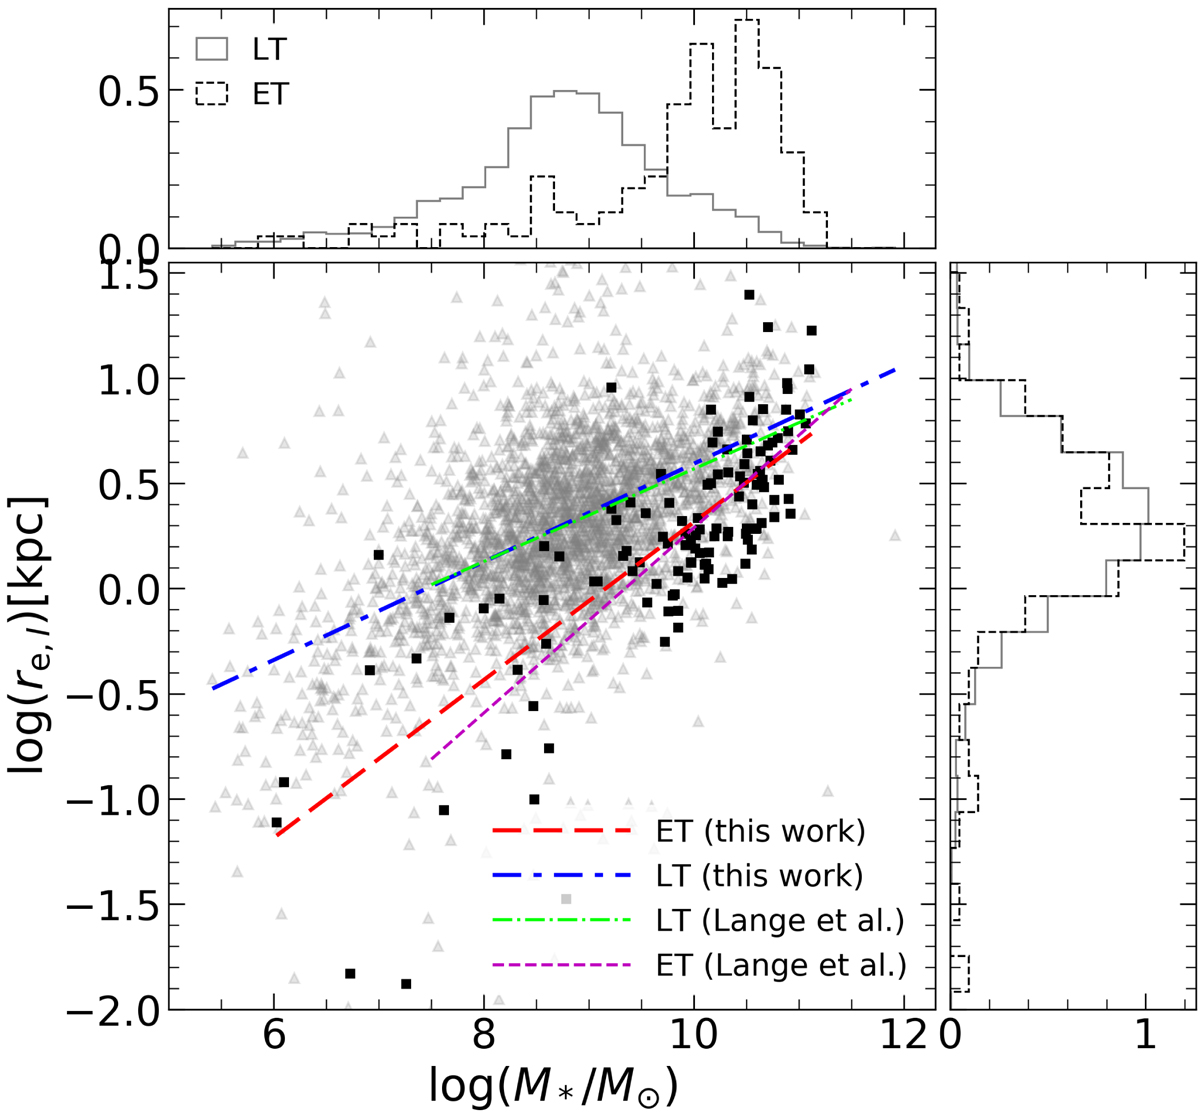
Mass–size relation. Gray triangles and black squares show LT and ET galaxies, respectively. Dot-dashed blue and dashed red lines show linear fits for LT and ET data, respectively. Thin dot-dashed green and dashed magenta lines represent LT and ET MSR from Lange et al. (2015). Top and right panels: density histograms of stellar mass and size, respectively. The results of the fitted power law parameters are given at the bottom of Table 2.
Current usage metrics show cumulative count of Article Views (full-text article views including HTML views, PDF and ePub downloads, according to the available data) and Abstracts Views on Vision4Press platform.
Data correspond to usage on the plateform after 2015. The current usage metrics is available 48-96 hours after online publication and is updated daily on week days.
Initial download of the metrics may take a while.