Fig. 10.
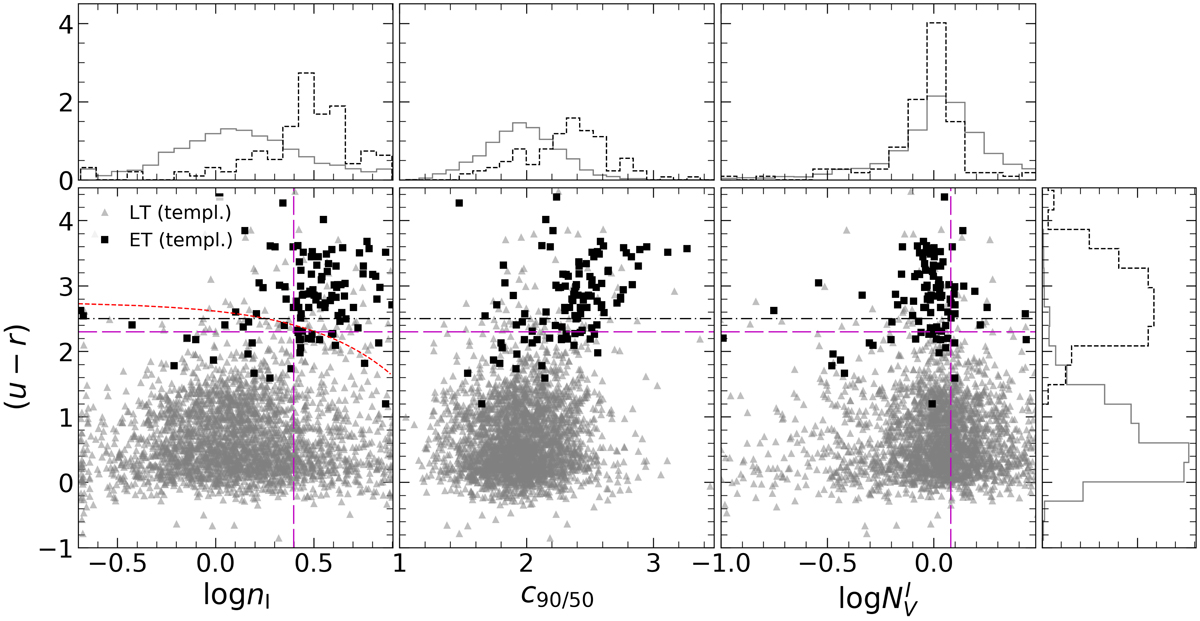
Observed (u − r) colour as a function of morphological parameters. From left to right: Sérsic index, nI, concentration index, c90/50, and wavelength-dependent ratio of Sérsic indices ![]() . Triangles and solid lines in gray (histograms) show LT, squares and dashed lines in black (histograms) show ET galaxies. The top histograms correspond to the respective value, as indicated in x-axis label, while right-hand histogram show the (u − r) colour distribution. All histograms represent density distributions. Horizontal dot-dashed line in black shows (u − r) = 2.5. Red dashed line show linear discriminant analysis result from de Diego et al. (2020). Dashed lines in magenta represent limits from Vika et al. (2015): vertical cut in (u − r) = 2.3, while on the left and right panels horizontal dashed-lines in magenta represent log(nI) = 0.4 and
. Triangles and solid lines in gray (histograms) show LT, squares and dashed lines in black (histograms) show ET galaxies. The top histograms correspond to the respective value, as indicated in x-axis label, while right-hand histogram show the (u − r) colour distribution. All histograms represent density distributions. Horizontal dot-dashed line in black shows (u − r) = 2.5. Red dashed line show linear discriminant analysis result from de Diego et al. (2020). Dashed lines in magenta represent limits from Vika et al. (2015): vertical cut in (u − r) = 2.3, while on the left and right panels horizontal dashed-lines in magenta represent log(nI) = 0.4 and ![]() , respectively (see Sect. 6).
, respectively (see Sect. 6).
Current usage metrics show cumulative count of Article Views (full-text article views including HTML views, PDF and ePub downloads, according to the available data) and Abstracts Views on Vision4Press platform.
Data correspond to usage on the plateform after 2015. The current usage metrics is available 48-96 hours after online publication and is updated daily on week days.
Initial download of the metrics may take a while.