Fig. 4
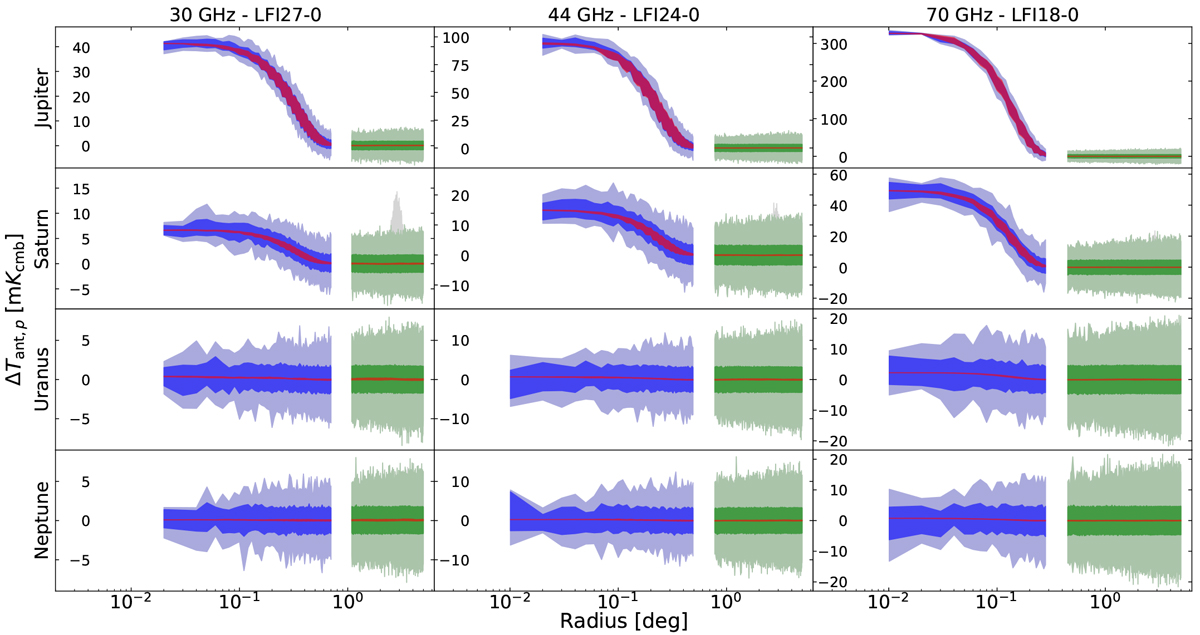
Antenna temperature estimates Tant for Jupiter, Saturn, Uranus, and Neptune (top to bottom) and for three radiometers representative of the 30 GHz (left), 44 GHz (centre), and 70 GHz (right) channels, as a function of the angular distance from the beam centre. The blue bands show the distribution of samples in the planet ROI (dark blue: 1σ region; light blue: peak-to-peak variation). The green bands have the same interpretation, but indicate the background ROI. The grey bands show the data before having been σ-clipped; for the case of Saturn observed by LFI27-0 a point source is present that was removed before the analysis (not present in the green line). The separation between the blue and green lines indicates the presence of the avoidance ROI, not included in our fits. The red line shows the best-fit model, and its width is the root mean square (RMS) of the model due to the ellipticity of the beam.
Current usage metrics show cumulative count of Article Views (full-text article views including HTML views, PDF and ePub downloads, according to the available data) and Abstracts Views on Vision4Press platform.
Data correspond to usage on the plateform after 2015. The current usage metrics is available 48-96 hours after online publication and is updated daily on week days.
Initial download of the metrics may take a while.