Fig. 6.
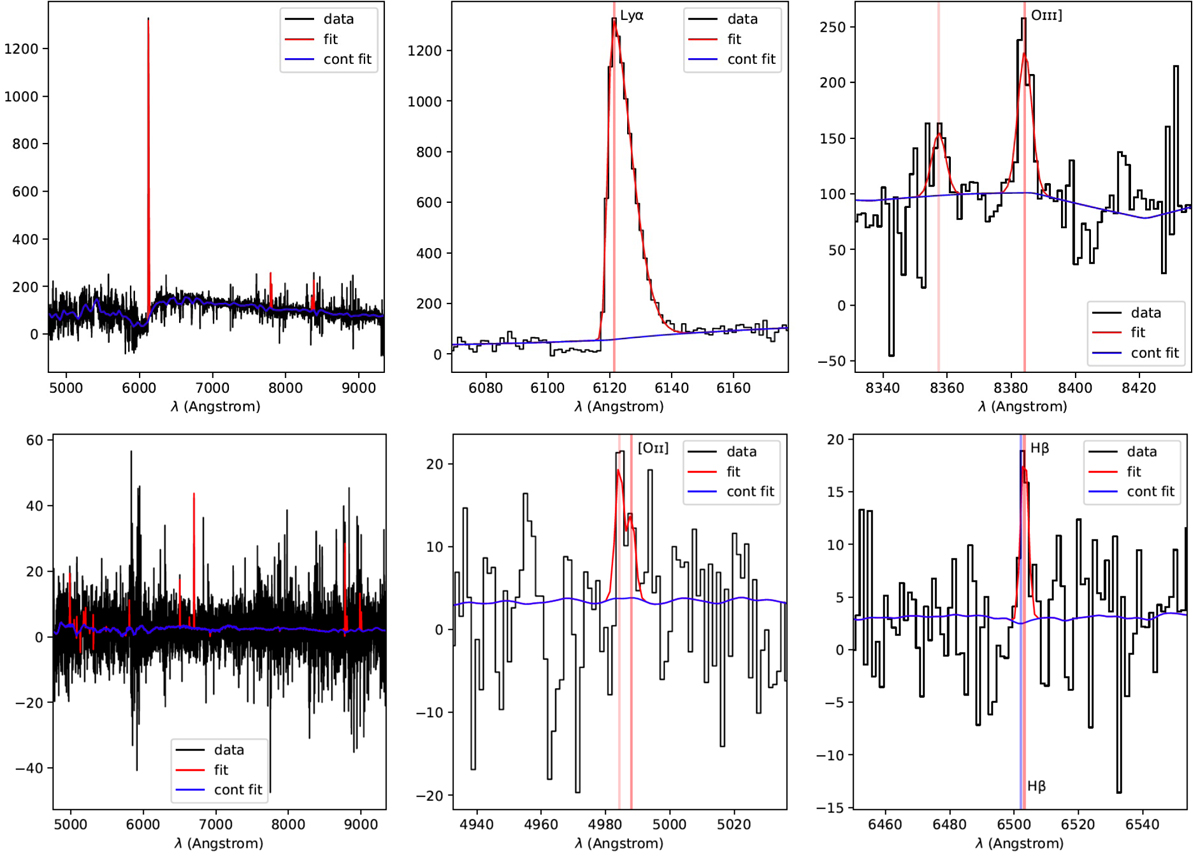
Examples of PYPLATEFIT spectral fitting, for two sources in our catalogues. Top row shows the case of the bright z = 4.03 galaxy in MACS0940 (Claeyssens et al. 2019) with zconf = 3 and the bottom row a MUSELET-selected galaxy at z = 0.337 and zconf = 2 in the same cluster field (M364). The left panel gives an overview of the spectrum, while the middle and right panels zoom in on specific spectral line fits. The best-fit spectrum and global continuum fit are plotted in red and blue, respectively.
Current usage metrics show cumulative count of Article Views (full-text article views including HTML views, PDF and ePub downloads, according to the available data) and Abstracts Views on Vision4Press platform.
Data correspond to usage on the plateform after 2015. The current usage metrics is available 48-96 hours after online publication and is updated daily on week days.
Initial download of the metrics may take a while.