Open Access
Fig. B.1.
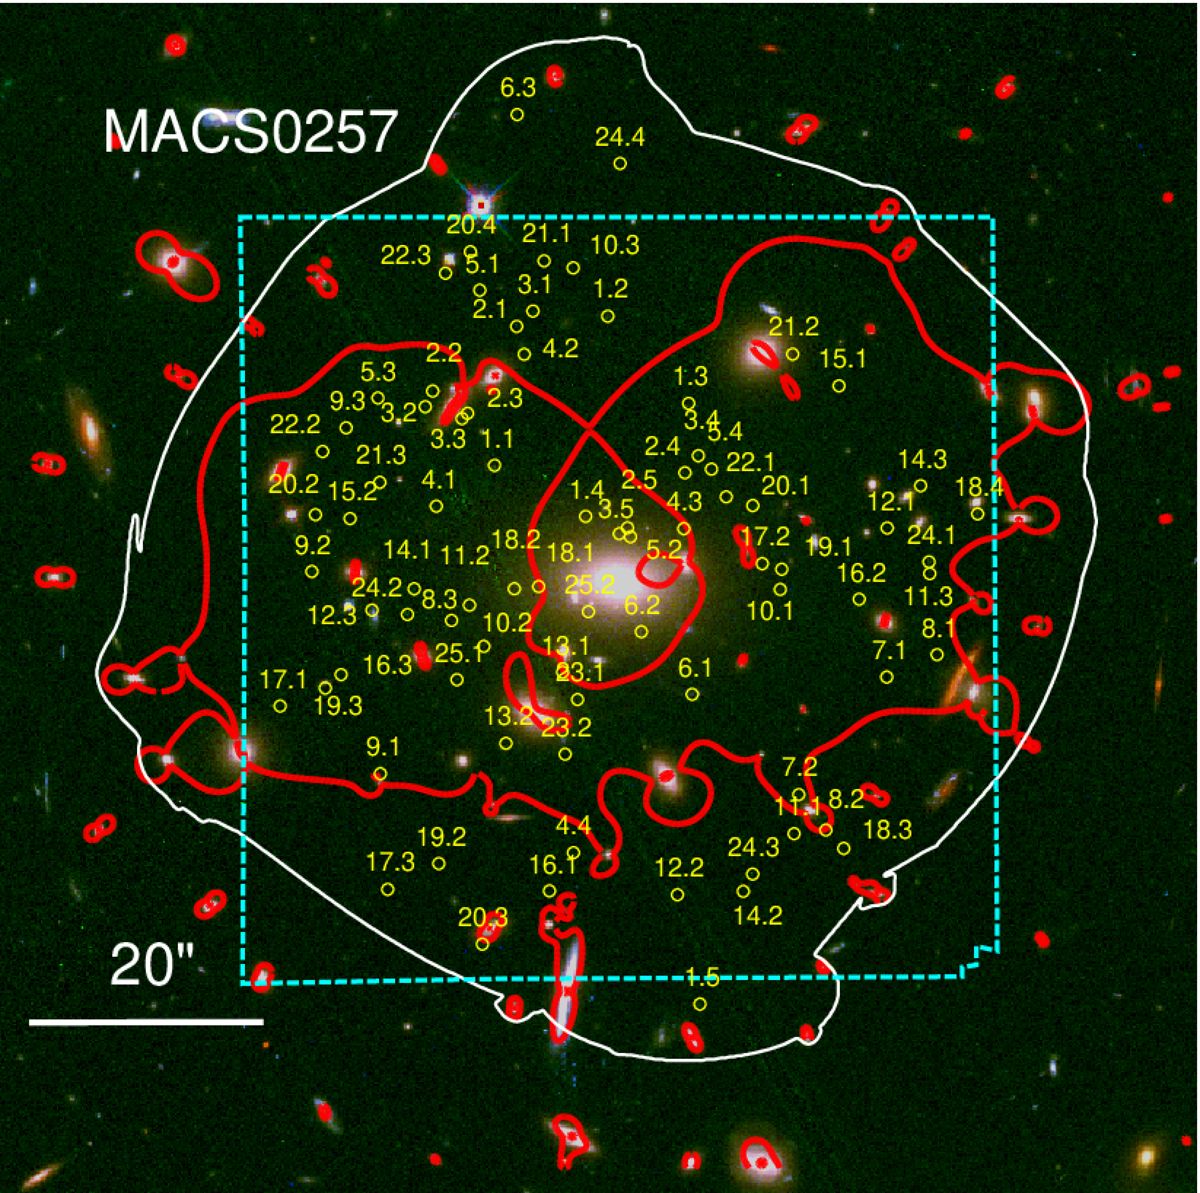
Overview of all multiply-imaged systems used in the strong-lensing model of MACS0257. The cyan dashed line highlights the limits of the MUSE observations. The white line represents the limit of the region where we expect multiples images. The red line delineates the critical line for a source at z = 4.
Current usage metrics show cumulative count of Article Views (full-text article views including HTML views, PDF and ePub downloads, according to the available data) and Abstracts Views on Vision4Press platform.
Data correspond to usage on the plateform after 2015. The current usage metrics is available 48-96 hours after online publication and is updated daily on week days.
Initial download of the metrics may take a while.