Fig. 12.
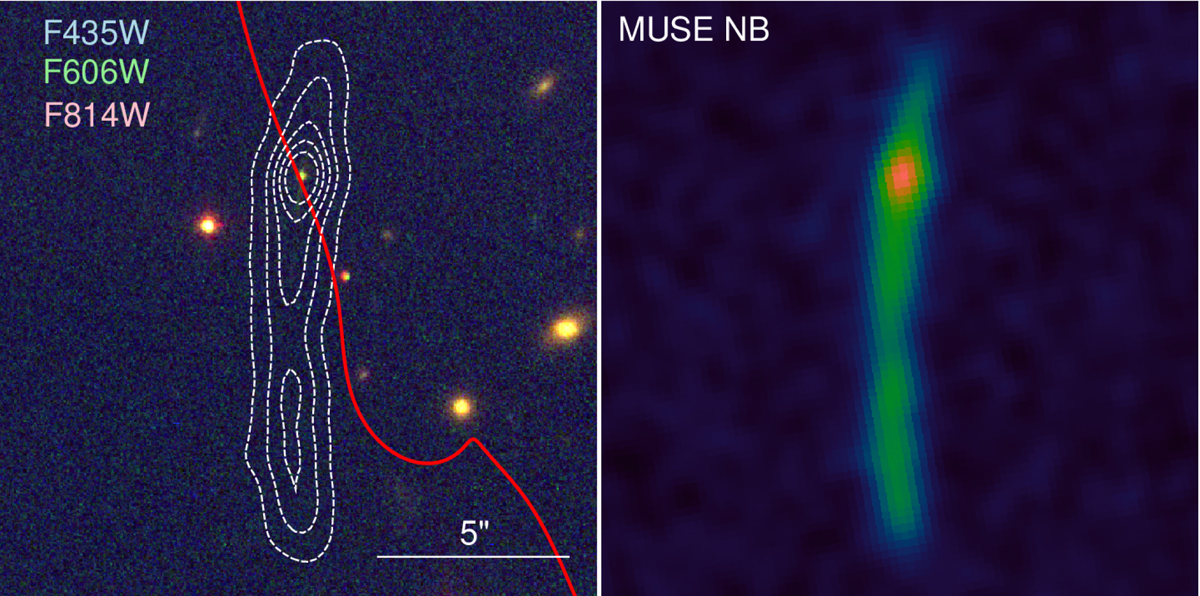
Example of very extended Lyman-α emitter in RXJ1347 (system 25), at z = 4.086. Left panel shows the HST colour image and the right panel the MUSE NB image around the Lyman-α emission. White dashed contours of the NB are overlayed on HST. The red curve shows the critical line at this redshift, which crosses the arc-shaped Lyman-α emission at the location of a point-like source in HST.
Current usage metrics show cumulative count of Article Views (full-text article views including HTML views, PDF and ePub downloads, according to the available data) and Abstracts Views on Vision4Press platform.
Data correspond to usage on the plateform after 2015. The current usage metrics is available 48-96 hours after online publication and is updated daily on week days.
Initial download of the metrics may take a while.