Fig. 11.
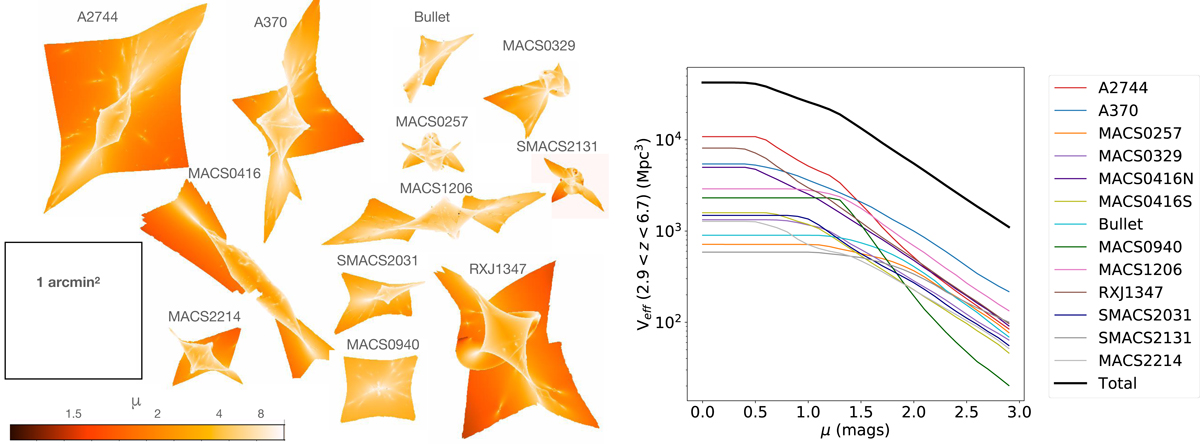
Left panel: source plane coverage of each cluster at z = 4, as a function of the strong lensing magnification of the most magnified image. The black square shows a 1 arcmin2 for scale. Right panel: effective volume surveyed at 2.9 < z < 6.7 with MUSE for Lyman-α emitters, as a function of the magnification of the brightest image. Presented are individual volumes behind each cluster and the total over all fields.
Current usage metrics show cumulative count of Article Views (full-text article views including HTML views, PDF and ePub downloads, according to the available data) and Abstracts Views on Vision4Press platform.
Data correspond to usage on the plateform after 2015. The current usage metrics is available 48-96 hours after online publication and is updated daily on week days.
Initial download of the metrics may take a while.