Fig. 9.
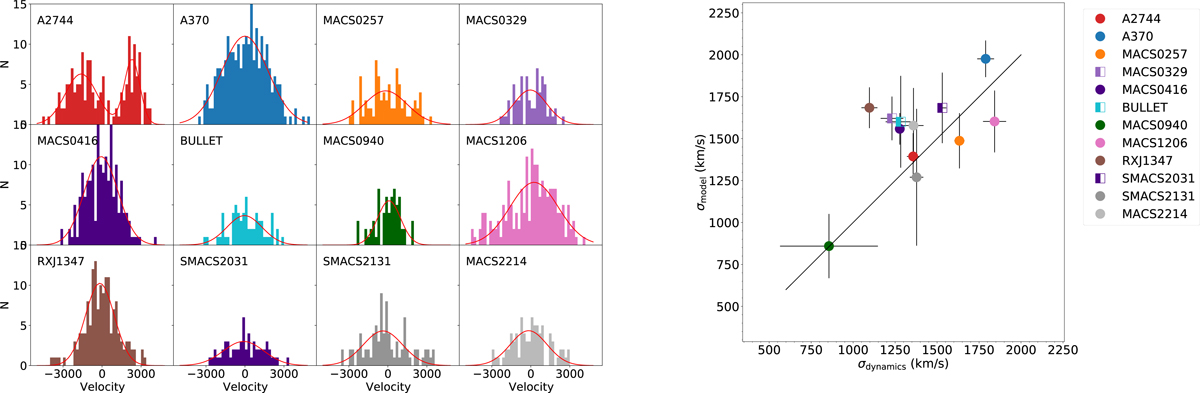
Left panel: velocity distribution of cluster members for each of the 12 fields. The red curves shows the best fit Gaussian model of the distribution (2 Gaussian components in Abell 2744). Right panel: comparison between the total velocity dispersion from the dPIE profiles in the mass model and the total velocity dispersion from the velocity distribution. The square symbols mark the three clusters with only partial MUSE coverage in the cluster cores.
Current usage metrics show cumulative count of Article Views (full-text article views including HTML views, PDF and ePub downloads, according to the available data) and Abstracts Views on Vision4Press platform.
Data correspond to usage on the plateform after 2015. The current usage metrics is available 48-96 hours after online publication and is updated daily on week days.
Initial download of the metrics may take a while.