Fig. 8.
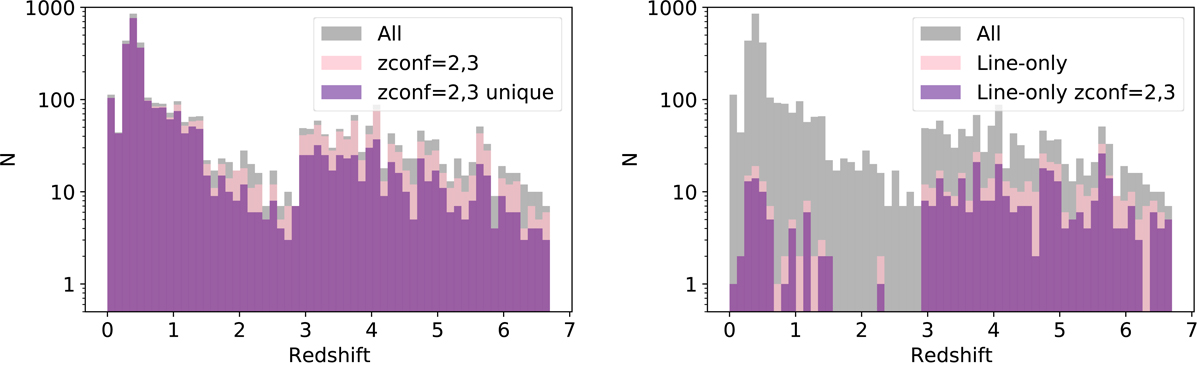
Global redshift distribution of MUSE sources in the lensing cluster fields. Left panel: comparison between the overall distribution and sources with high confidence redshifts (zconf = 2, 3), the latter before and after (‘unique’) accounting for image multiplicity. Right panel: comparison between the overall distribution and the line-only sources (pure line emitters without any HST counterpart, see Sect. 3.9).
Current usage metrics show cumulative count of Article Views (full-text article views including HTML views, PDF and ePub downloads, according to the available data) and Abstracts Views on Vision4Press platform.
Data correspond to usage on the plateform after 2015. The current usage metrics is available 48-96 hours after online publication and is updated daily on week days.
Initial download of the metrics may take a while.