Fig. 8.
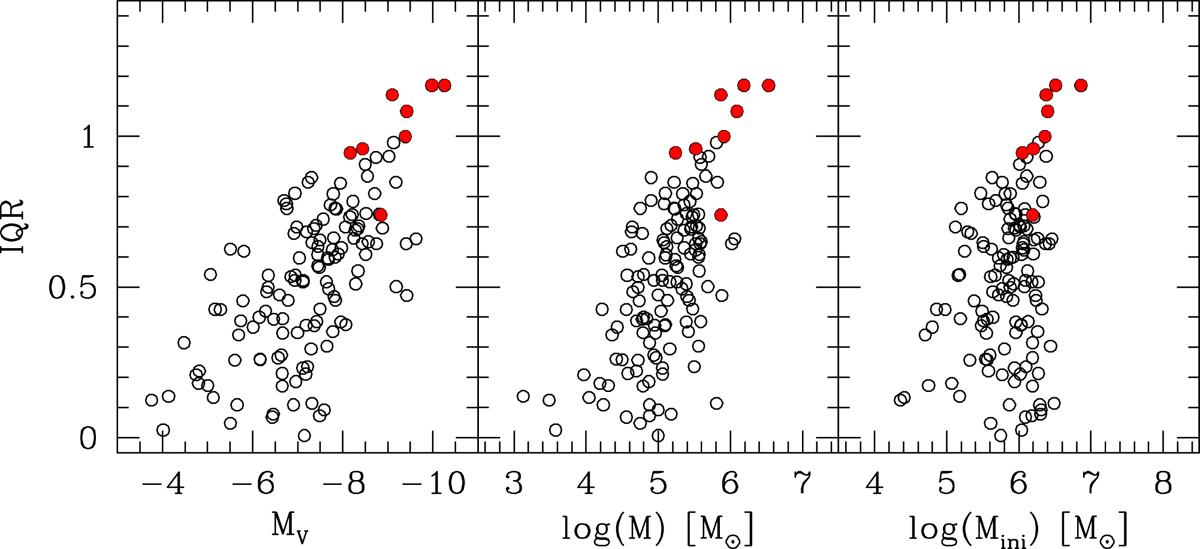
Extension of the Na-O anti-correlation as given by the empirically calibrated IQR2[O/Na] values from Carretta (2019) as a function of total absolute magnitude MV from Harris (1996, 2010 online edition; left panel) and of the present-day and original total GC masses (middle and right panels, respectively) from Baumgardt et al. (2018). GCs with robust detection of changes in Ca (K and Sc) in the present census are indicated with filled red circles.
Current usage metrics show cumulative count of Article Views (full-text article views including HTML views, PDF and ePub downloads, according to the available data) and Abstracts Views on Vision4Press platform.
Data correspond to usage on the plateform after 2015. The current usage metrics is available 48-96 hours after online publication and is updated daily on week days.
Initial download of the metrics may take a while.