Open Access
Fig. 1
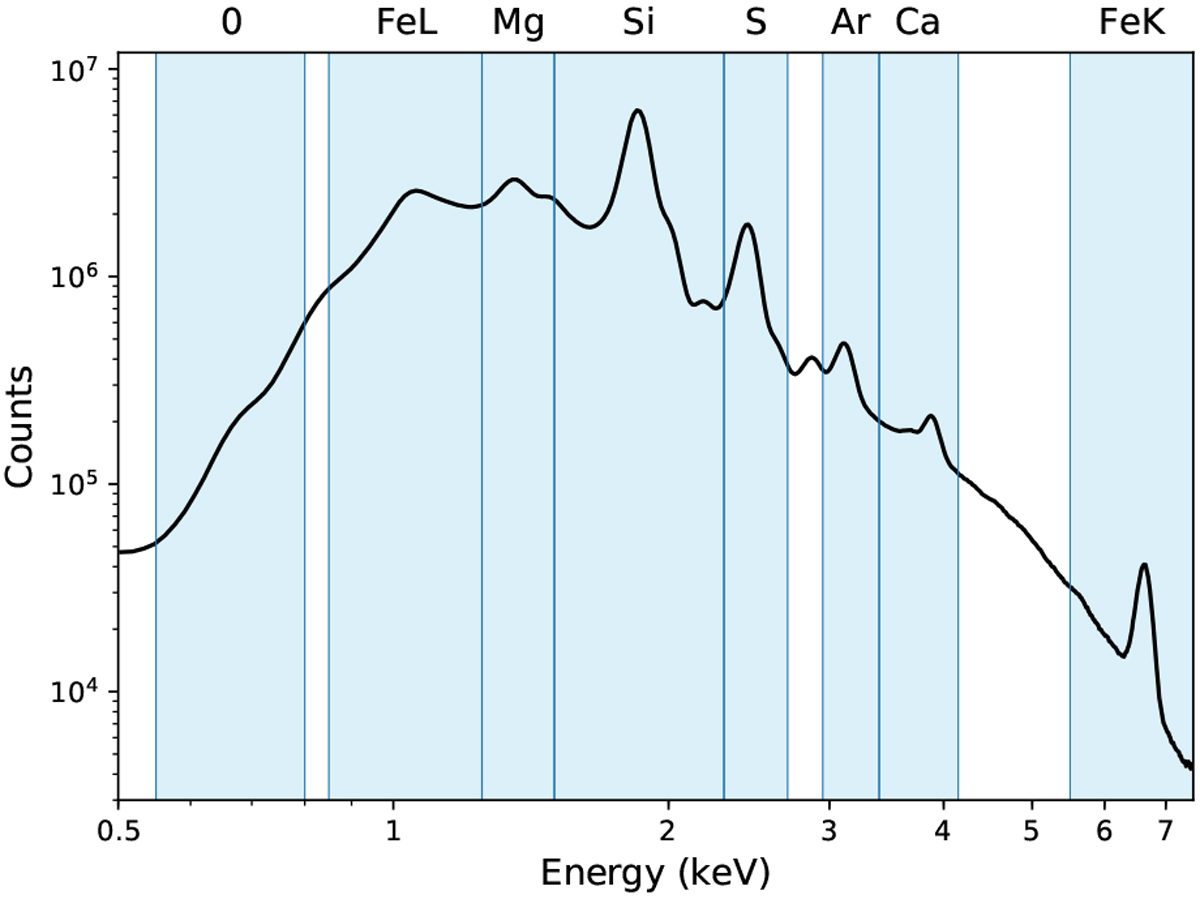
Spectrum of Cas A obtained from the combination of the deep Chandra 2004 observations. The source separation algorithm was applied in each individual energy band band, which are represented by the shaded regions.
Current usage metrics show cumulative count of Article Views (full-text article views including HTML views, PDF and ePub downloads, according to the available data) and Abstracts Views on Vision4Press platform.
Data correspond to usage on the plateform after 2015. The current usage metrics is available 48-96 hours after online publication and is updated daily on week days.
Initial download of the metrics may take a while.