Fig. 3.
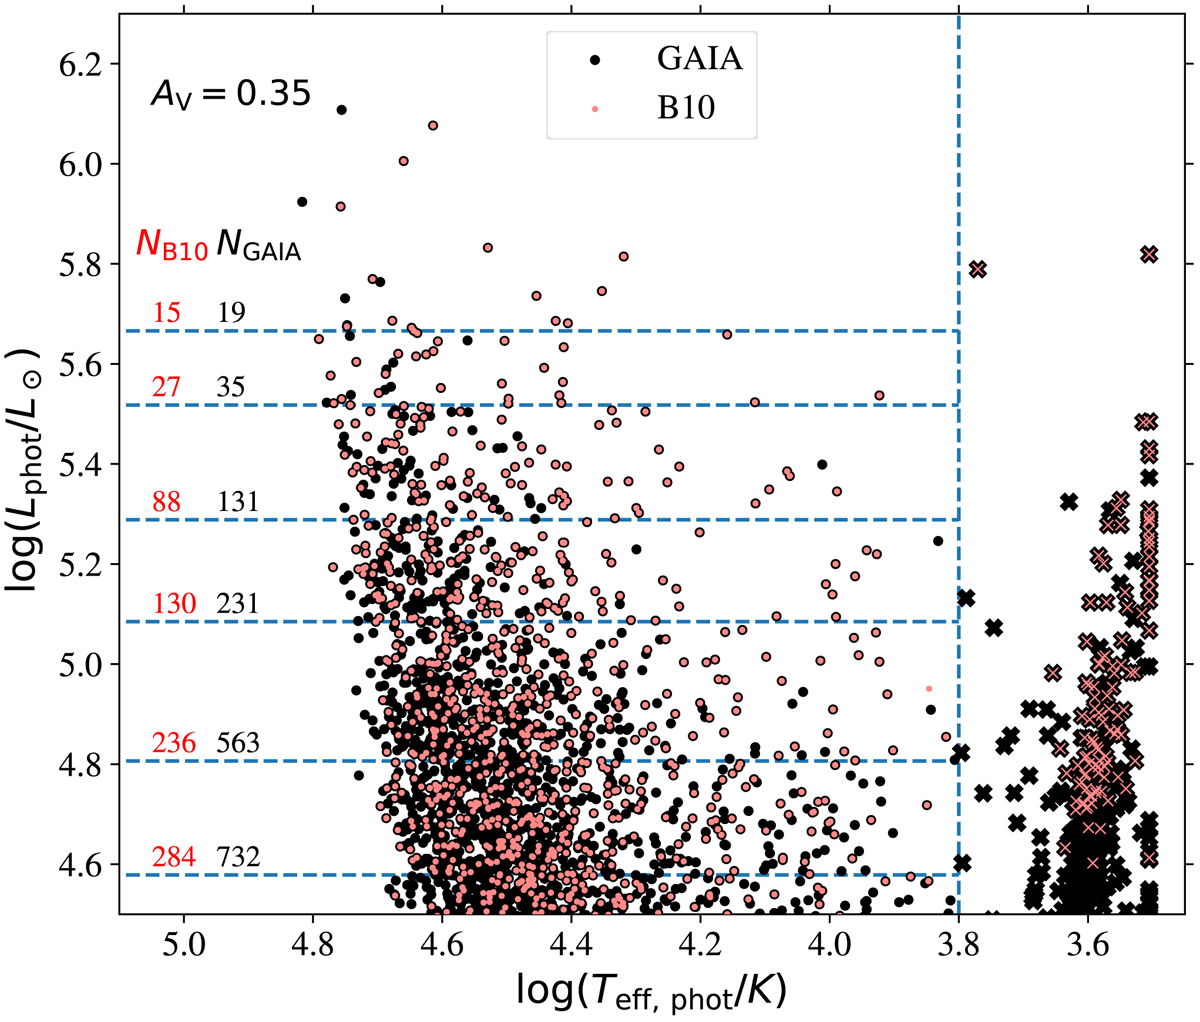
Hertzsprung-Russell diagram of bright SMC sources constructed with Gaia photometry. Black markers indicate sources from the Gaia sample. The smaller red markers are sources in the B10 sample. Therefore, red points with black edges (all but one of the red points, see Appendix A) are sources that are listed in both samples. We count the number of sources that are hotter than 103.8 K for both samples in different luminosity intervals. The numbers are displayed on the left side of the plot. The luminosity intervals are indicated by dashed blue lines. For completeness, we also show the cool sources with crosses.
Current usage metrics show cumulative count of Article Views (full-text article views including HTML views, PDF and ePub downloads, according to the available data) and Abstracts Views on Vision4Press platform.
Data correspond to usage on the plateform after 2015. The current usage metrics is available 48-96 hours after online publication and is updated daily on week days.
Initial download of the metrics may take a while.