Free Access
Fig. B.9.
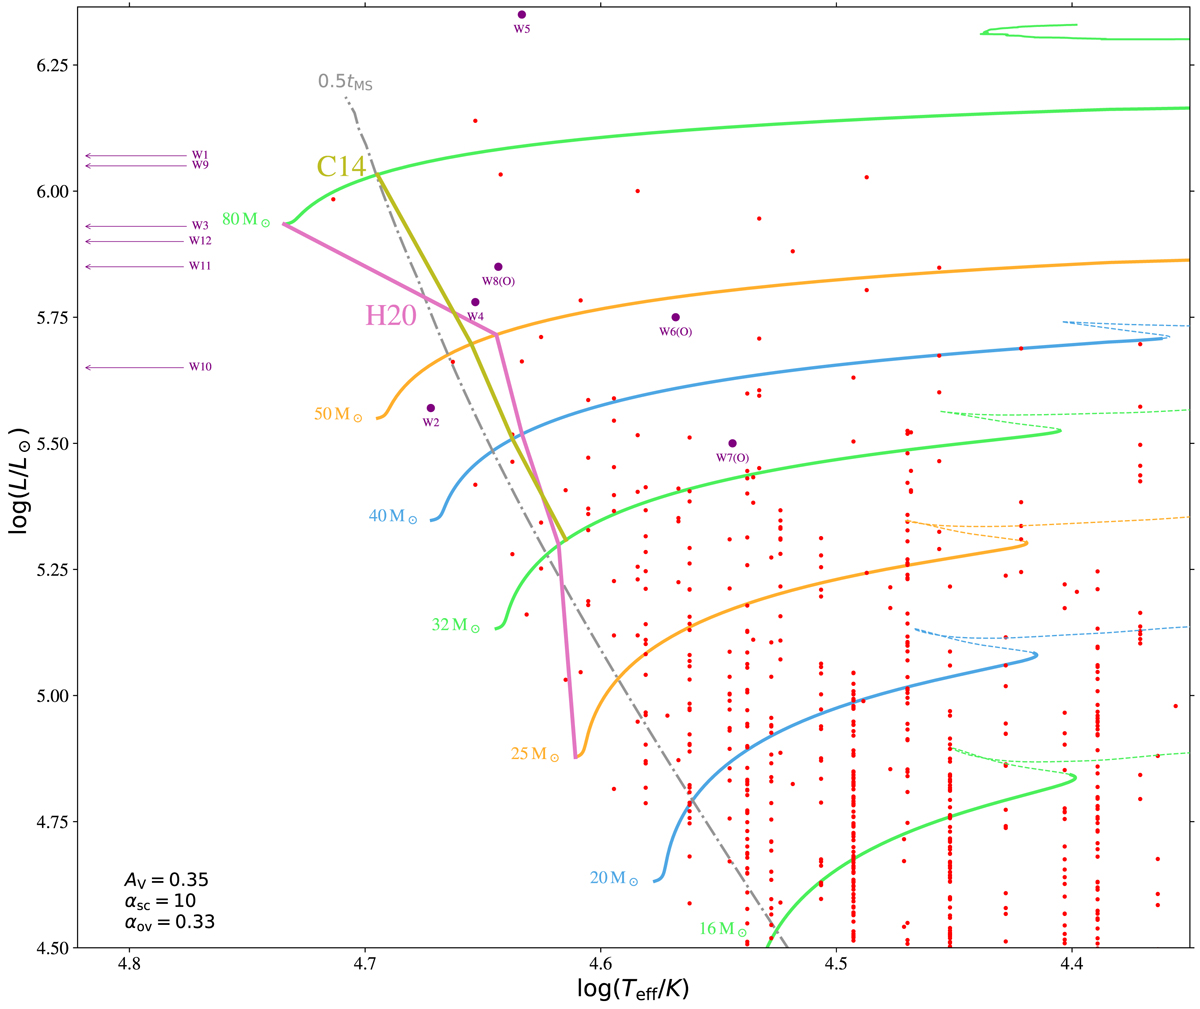
Same as Fig. 5, but here we indicate the regions that were found to be devoid of stars in earlier studies. To be more precise, there are no stars at the hot side of these lines in those studies. C14 means Castro et al. (2014), and H20 means Holgado et al. (2020). We note that we only show the hot stars in this diagram.
Current usage metrics show cumulative count of Article Views (full-text article views including HTML views, PDF and ePub downloads, according to the available data) and Abstracts Views on Vision4Press platform.
Data correspond to usage on the plateform after 2015. The current usage metrics is available 48-96 hours after online publication and is updated daily on week days.
Initial download of the metrics may take a while.