Fig. 11.
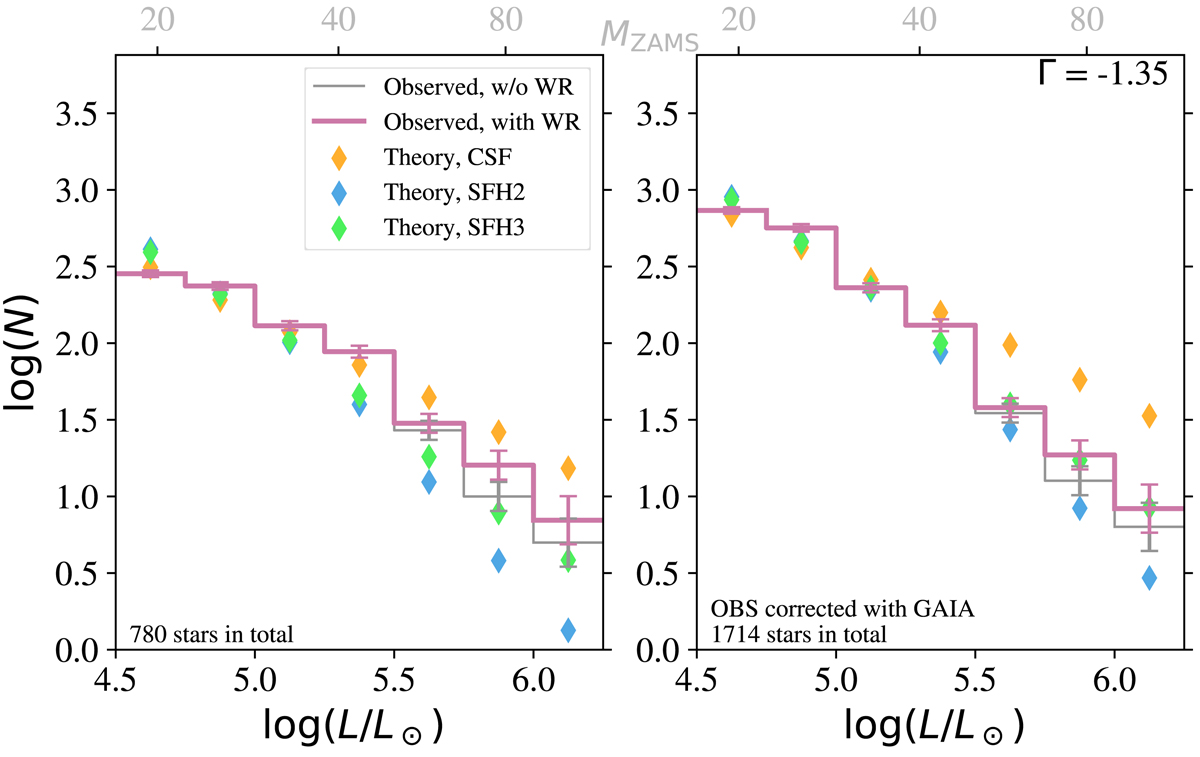
Diagrams showing the high end of the distribution of luminosities that we derived for sources in the Bonanos et al. (2010) data set. Left is the uncorrected distribution. Right is the distribution corrected for the completeness of the B10 data set using Gaia data. For comparison, we show the theoretical values (diamonds) for different star formation history scenarios. We also show the number distributions when the brightest source in the WR star system is taken out.
Current usage metrics show cumulative count of Article Views (full-text article views including HTML views, PDF and ePub downloads, according to the available data) and Abstracts Views on Vision4Press platform.
Data correspond to usage on the plateform after 2015. The current usage metrics is available 48-96 hours after online publication and is updated daily on week days.
Initial download of the metrics may take a while.