Fig. 10.
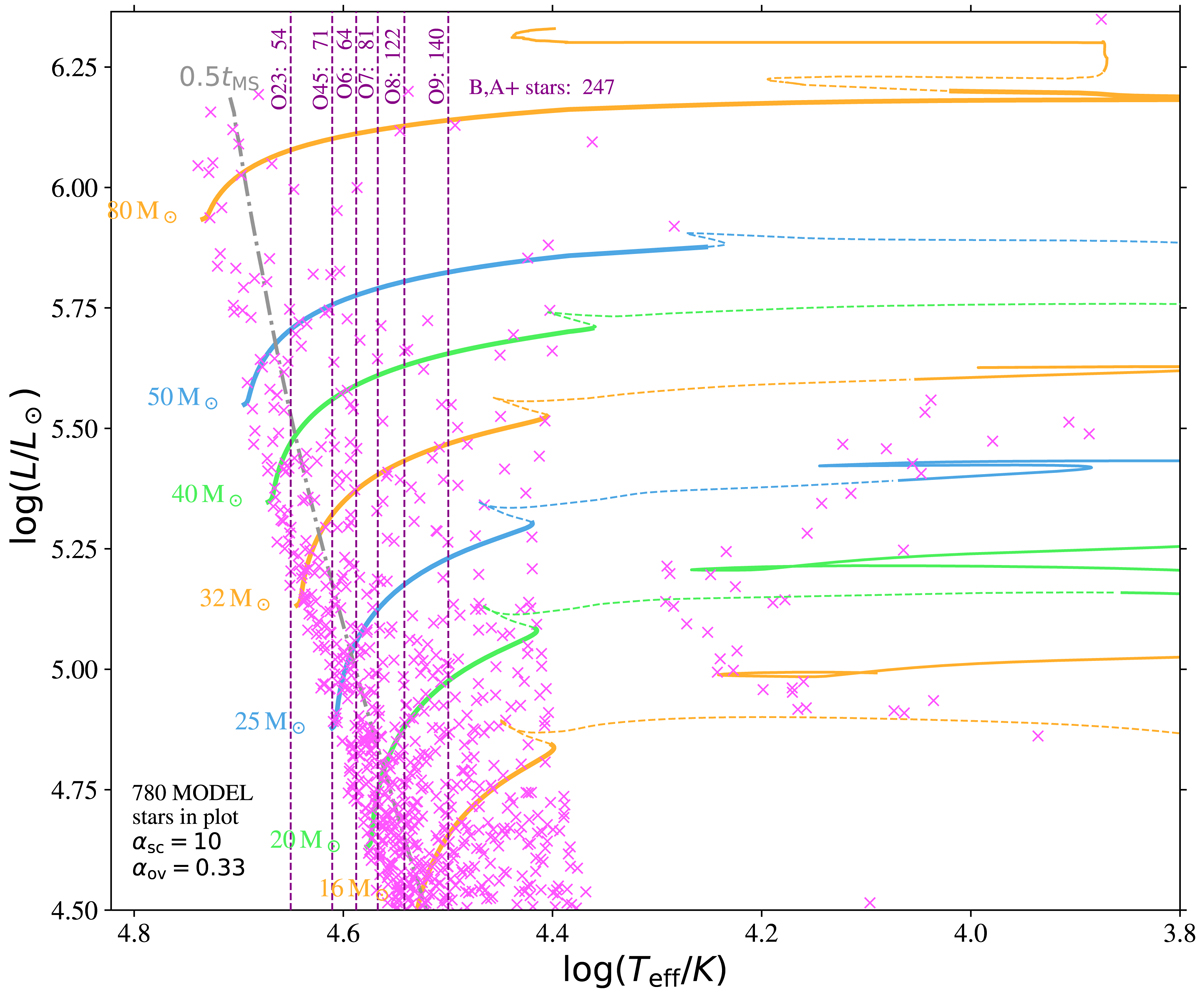
Same as Fig. 5, except that it contains randomly drawn synthetic stars (purple crosses) and that the x-axis range does not extend to the temperature regime of red stars. The dashed lines separate the temperature ranges covered by different spectral types of luminosity class V, according to our spectral type-temperature relation (Sect. 2.1).
Current usage metrics show cumulative count of Article Views (full-text article views including HTML views, PDF and ePub downloads, according to the available data) and Abstracts Views on Vision4Press platform.
Data correspond to usage on the plateform after 2015. The current usage metrics is available 48-96 hours after online publication and is updated daily on week days.
Initial download of the metrics may take a while.