Free Access
Fig. 5
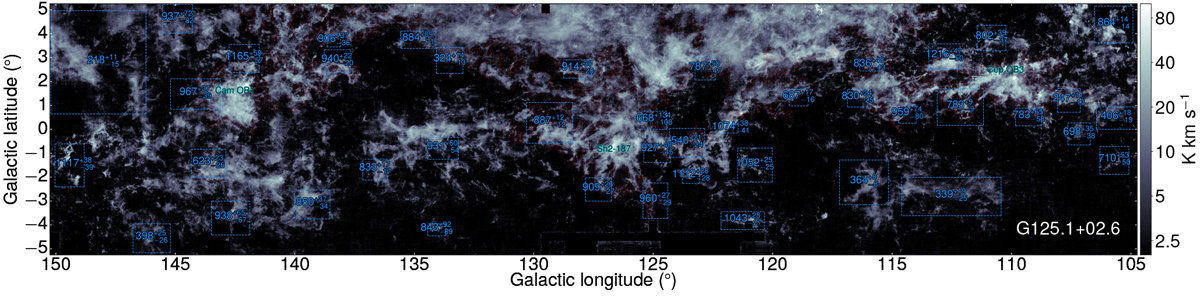
Distances to the largest molecular cloud, G125.1+02.6. The edge of the molecular cloud is delineated with the red line. The integrated velocity range is [−22.63, 7.55] km s−1. The distance is in parsecs, and the distances to many molecular clouds around G125.1+02.6 are also displayed.
Current usage metrics show cumulative count of Article Views (full-text article views including HTML views, PDF and ePub downloads, according to the available data) and Abstracts Views on Vision4Press platform.
Data correspond to usage on the plateform after 2015. The current usage metrics is available 48-96 hours after online publication and is updated daily on week days.
Initial download of the metrics may take a while.