Fig. 7.
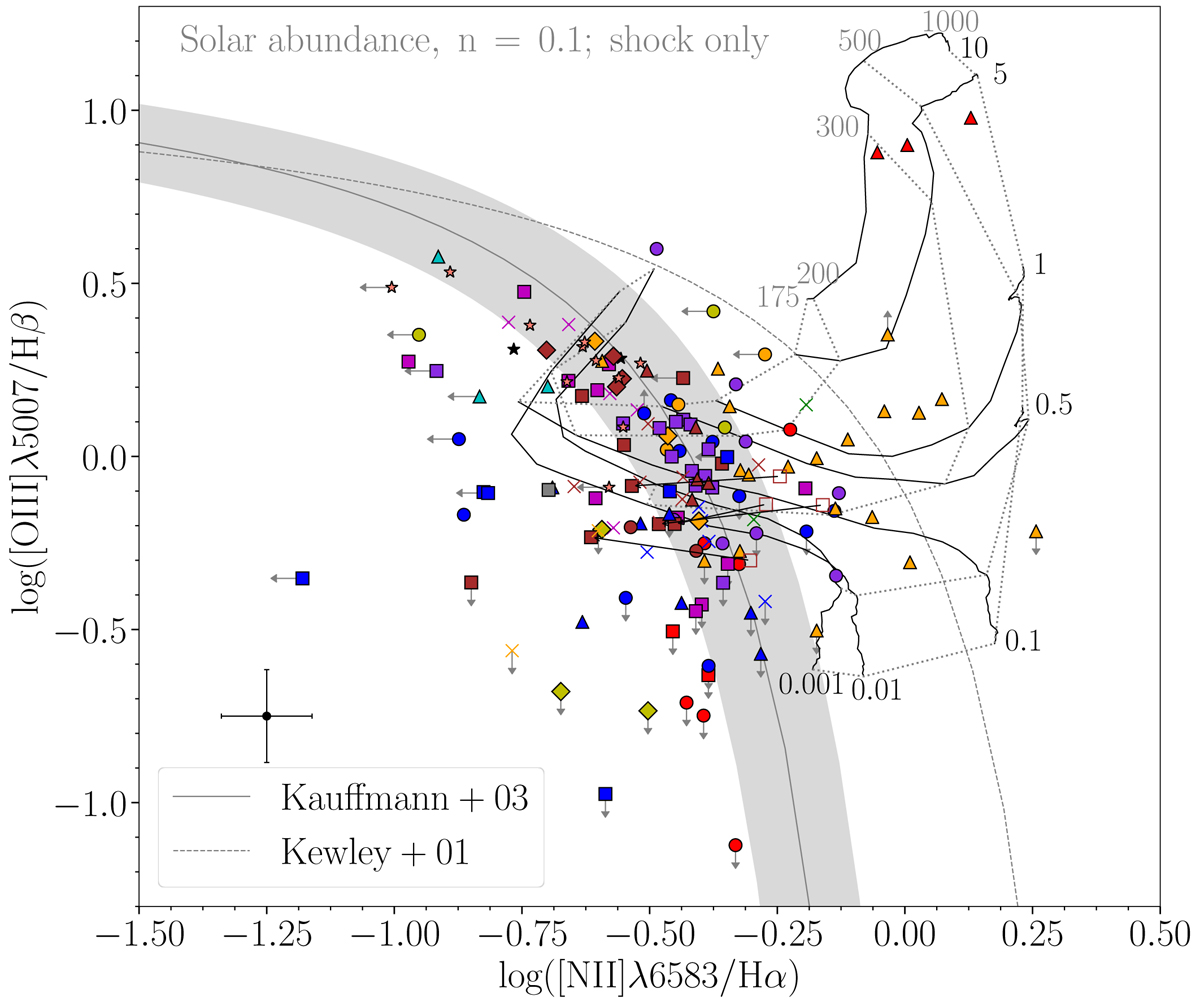
Diagnostic diagram (BPT) of [O III]λ5007/Hβ versus [N II]λ6584/Hα for the SQ Hα emission regions. Regions without an arrow have a S/N higher than 3 for the fluxes in the strong emission lines Hα, Hβ, [O III]λ5007, and [N II]λ6584. The typical error in each axis is represent with a black cross. Regions with an ascending grey arrow have a S/N(Hβ) < 3, regions with a decreasing grey arrow have a S/N([O III]λ5007) < 3, while regions with a grey arrow pointing left have a S/N([N II]λ6584) < 3. All the points in the figure have the same colours and markers as Fig. 3. The grey dashed line shows the Kewley et al. (2001) demarcation and the grey continuous line shows the Kauffmann et al. (2003) curve. The grey band shows the uncertainties for the BPT line ratios (i.e. [O III]λ5007/Hβ and [N II]λ6584/Hα) to the Kauffmann demarcation. The black lines correspond to the shock only models of Allen et al. (2008) for solar metallicity and low density (n = 0.1 cm−3), while the dotted lines correspond to the shock velocity.
Current usage metrics show cumulative count of Article Views (full-text article views including HTML views, PDF and ePub downloads, according to the available data) and Abstracts Views on Vision4Press platform.
Data correspond to usage on the plateform after 2015. The current usage metrics is available 48-96 hours after online publication and is updated daily on week days.
Initial download of the metrics may take a while.