Fig. 9.
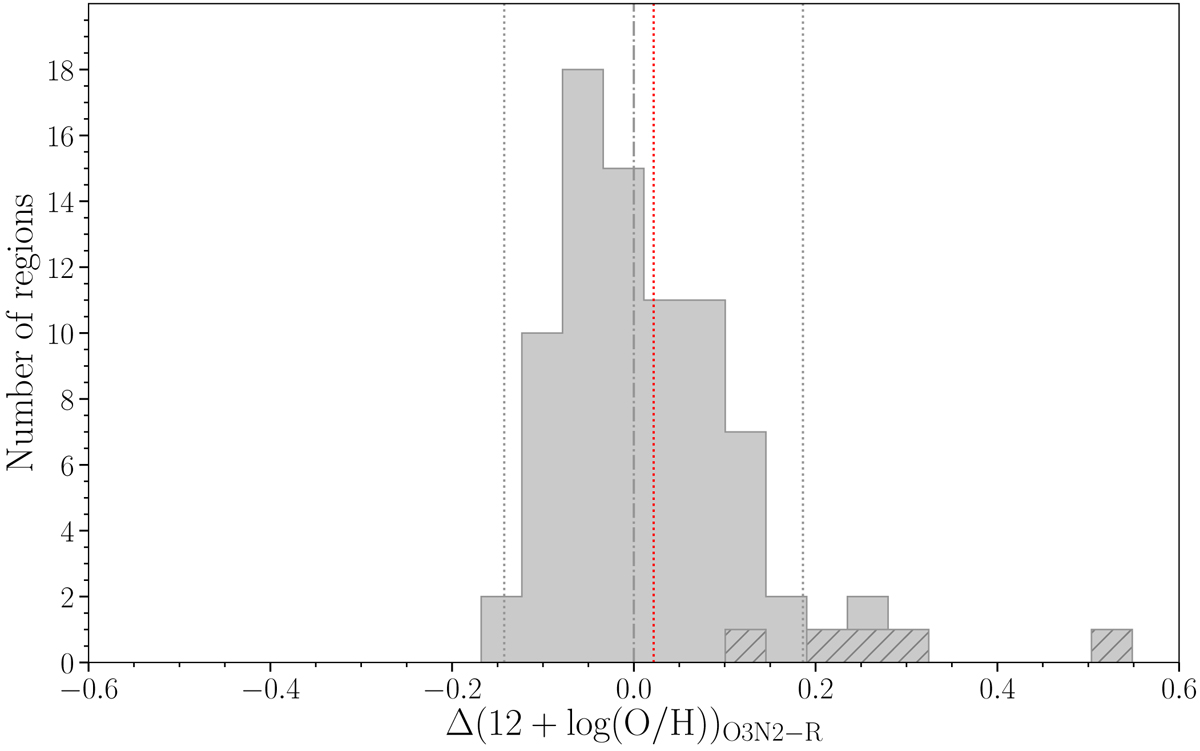
Distribution of difference of the oxygen abundance derived with O3N2 and R calibrations for SQ HII regions. The grey dashed line indicates a difference equal to zero, and the red dashed line corresponds to the mean oxygen abundance difference between O3N2 and R calibrators (0.02 dex) for SQ HII regions; grey dotted lines indicate the 3σ rms. The dashed histogram represents the sample of SQ HII regions when 12+log(O/H) < 8.4, for which the R calibrator was adopted.
Current usage metrics show cumulative count of Article Views (full-text article views including HTML views, PDF and ePub downloads, according to the available data) and Abstracts Views on Vision4Press platform.
Data correspond to usage on the plateform after 2015. The current usage metrics is available 48-96 hours after online publication and is updated daily on week days.
Initial download of the metrics may take a while.