Fig. 6.
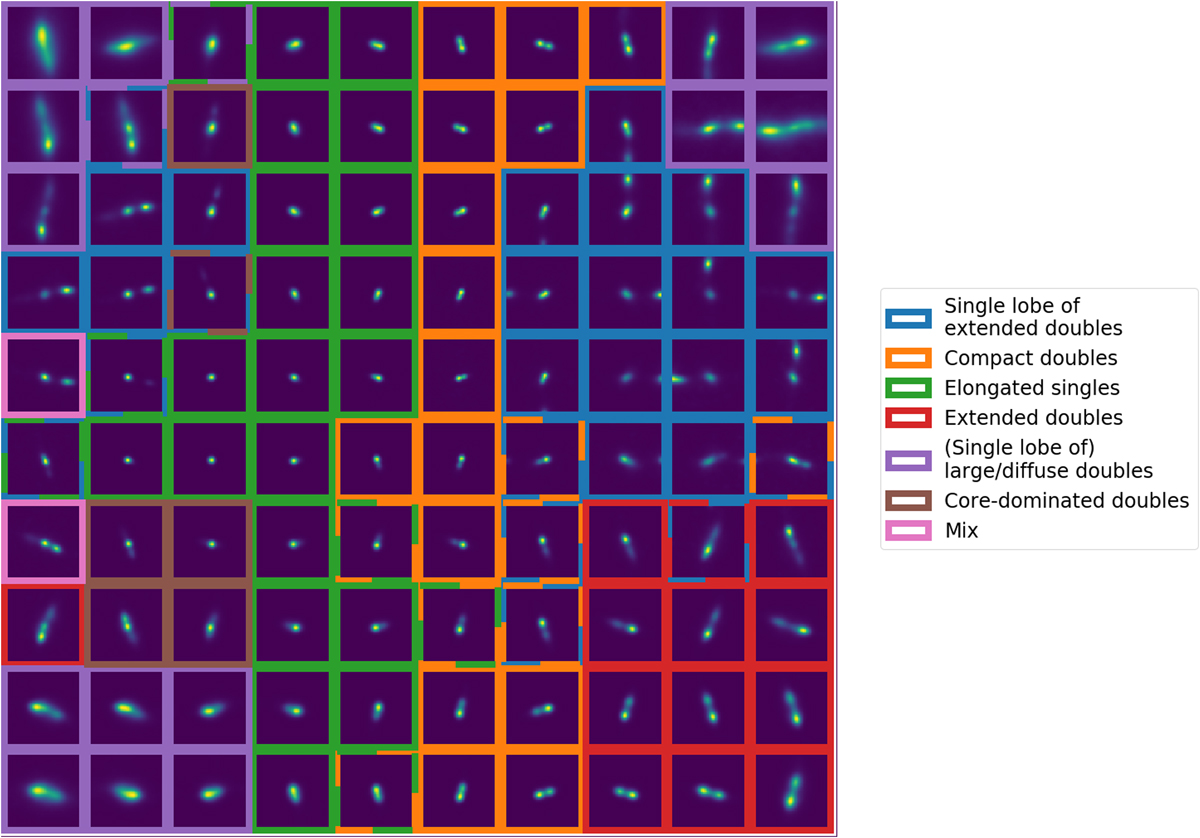
Final 10 × 10 cyclic SOM manually labelled into seven categories. These categories describe the type of sources that are dominant or most occurring in the set of sources that best matches each of the 100 representative images. If there are multiple dominant types of sources best matching a representative image, the representative image is labelled using multiple categories, which is visualised by the dashed multi-coloured edges.
Current usage metrics show cumulative count of Article Views (full-text article views including HTML views, PDF and ePub downloads, according to the available data) and Abstracts Views on Vision4Press platform.
Data correspond to usage on the plateform after 2015. The current usage metrics is available 48-96 hours after online publication and is updated daily on week days.
Initial download of the metrics may take a while.