Fig. 5.
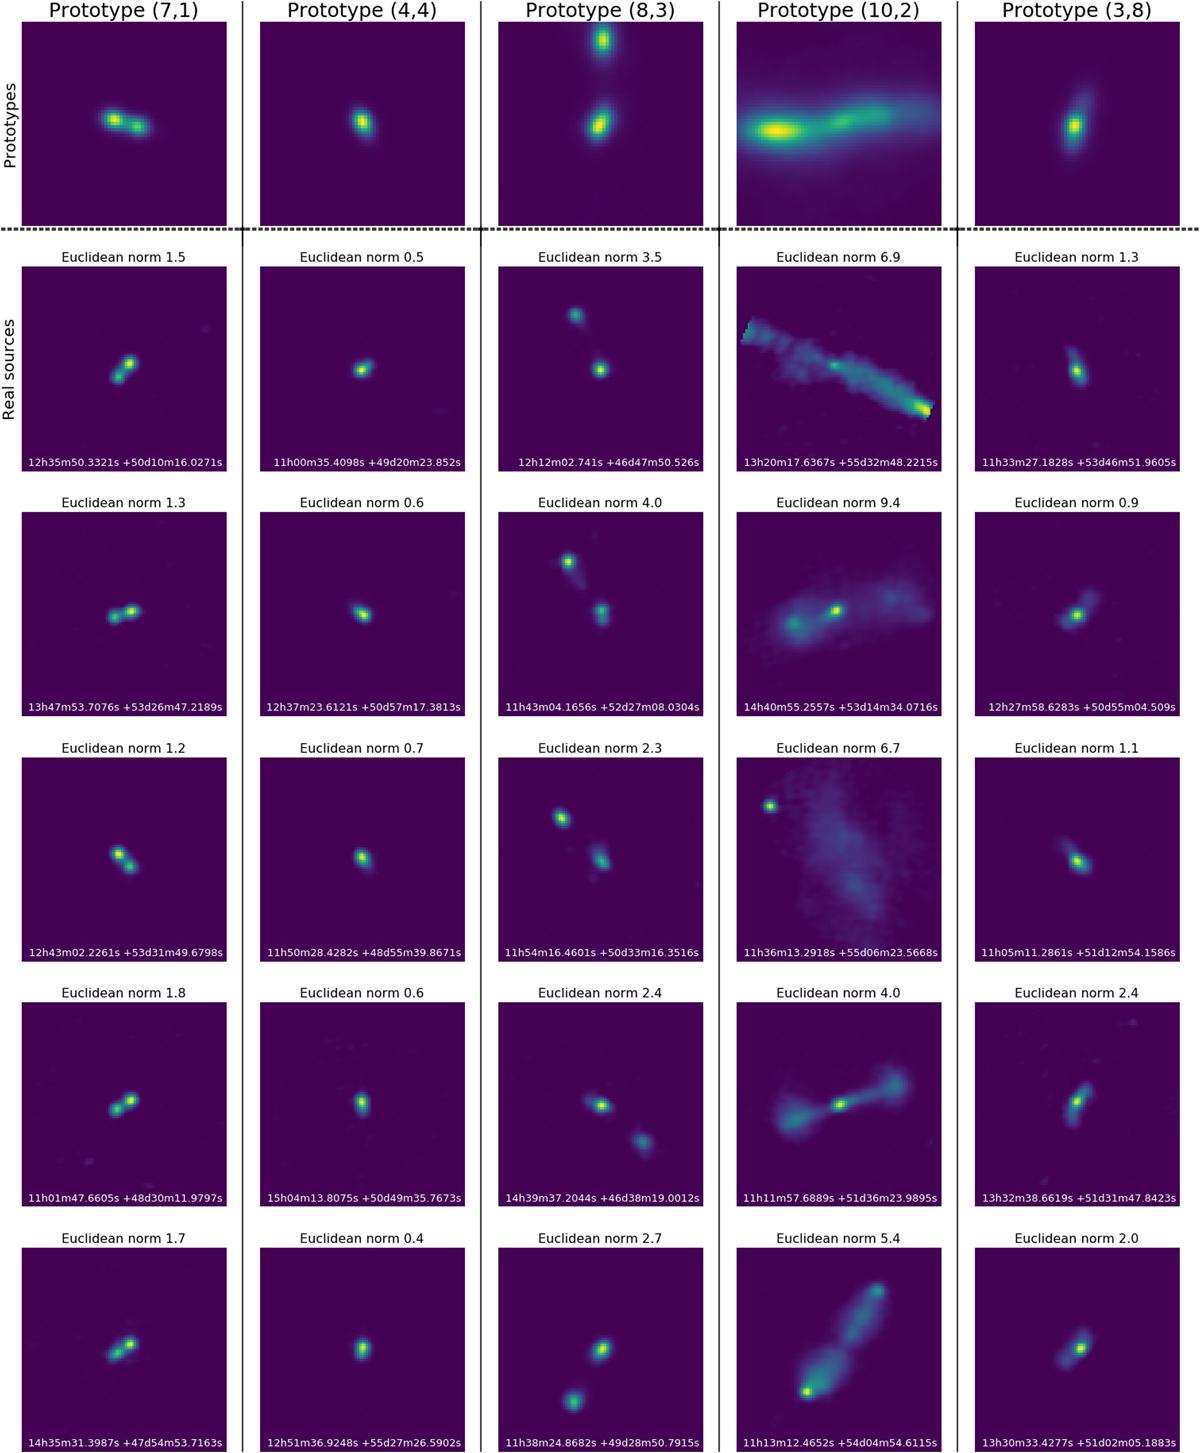
Closer look at five representative images with distinctly different shapes. The first row shows five hand-picked representative images from the trained SOM. The location of each representative image on the SOM is indicated by (column, row), thus the first highlighted representative image in this figure is positioned in the seventh column, second row of the SOM in Fig. 4. In each column, we show five (randomly selected) radio sources that have been mapped to the representative images in the first row.
Current usage metrics show cumulative count of Article Views (full-text article views including HTML views, PDF and ePub downloads, according to the available data) and Abstracts Views on Vision4Press platform.
Data correspond to usage on the plateform after 2015. The current usage metrics is available 48-96 hours after online publication and is updated daily on week days.
Initial download of the metrics may take a while.