Fig. 4
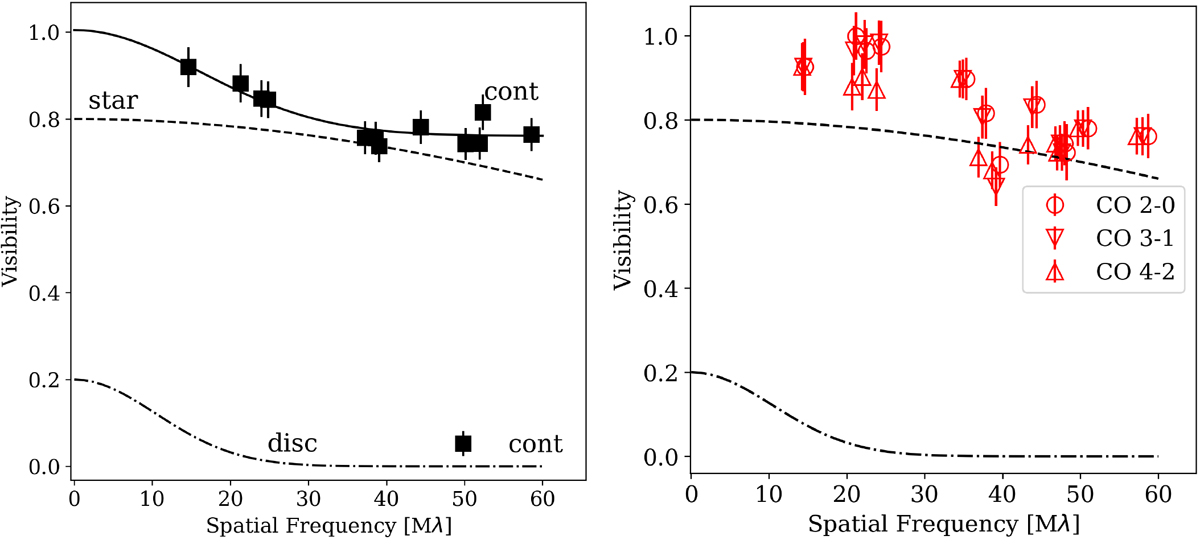
Left: visibility vs. spatial frequency for the continuum (black squares). The best fit to the total continuum emission (star+disc) is shown by the solid black line, the contribution of the star by the dashed line, and that of the disc by the dash-dotted line. Right: for comparison, we show the visibility at the peak of the 2–0 CO bandhead (filled red circles), the 3–1 CO bandhead (open red circles), and the 4–2 CO bandhead (red triangles). The black lines are the same as in the left panel.
Current usage metrics show cumulative count of Article Views (full-text article views including HTML views, PDF and ePub downloads, according to the available data) and Abstracts Views on Vision4Press platform.
Data correspond to usage on the plateform after 2015. The current usage metrics is available 48-96 hours after online publication and is updated daily on week days.
Initial download of the metrics may take a while.