Fig. 6.
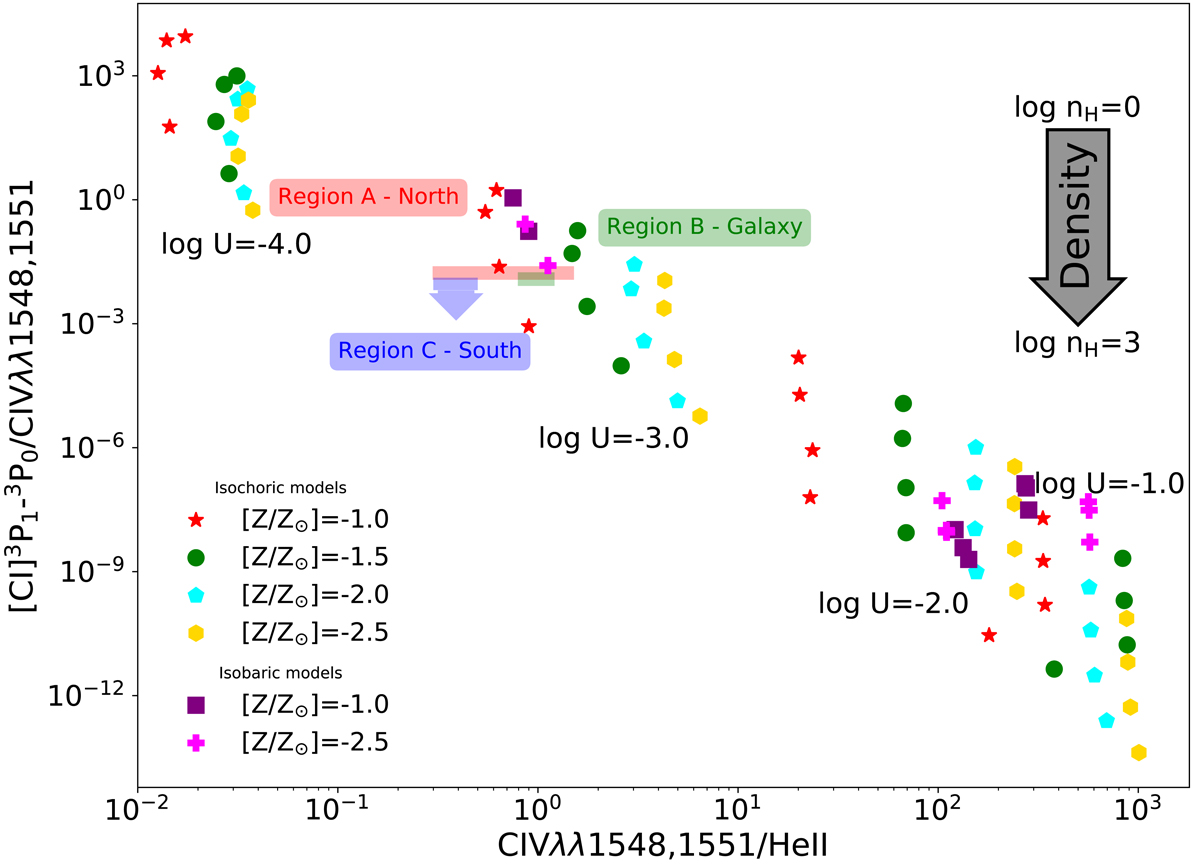
Line ratios of [C I]/C IV as a function of C IV/He II for the three regions as defined in Fig. 3 and Cloudy models. The colored points represent the photoionization and photodissociated region (PDR) models as indicated in the legend. The logarithm of the ionization parameter of each of the groups of points in the figure are indicated in the appropriate regions (decreasing from −1 to −4 dex from left to right). For each of the isochoric models, the density of the gas increases upward from log nH (cm−3) = 0 to 3. We also show a set of isobaric models for three pressures, log P/k (K cm−3) = 2, 3, and 4. The three colored boxes show the estimated line ratios, as estimated from our observations (red for region A; green for region B; and blue, which is an upper limit in [C I]/C IV, for region C). We note that the box shown exaggerates the uncertainty in [C I]/C IV and that it shows the range of plausible values for C IV/He II and not the uncertainties in the estimate. The apertures over which the lines fluxes were extracted are shown in Fig. 3.
Current usage metrics show cumulative count of Article Views (full-text article views including HTML views, PDF and ePub downloads, according to the available data) and Abstracts Views on Vision4Press platform.
Data correspond to usage on the plateform after 2015. The current usage metrics is available 48-96 hours after online publication and is updated daily on week days.
Initial download of the metrics may take a while.