Fig. 5.
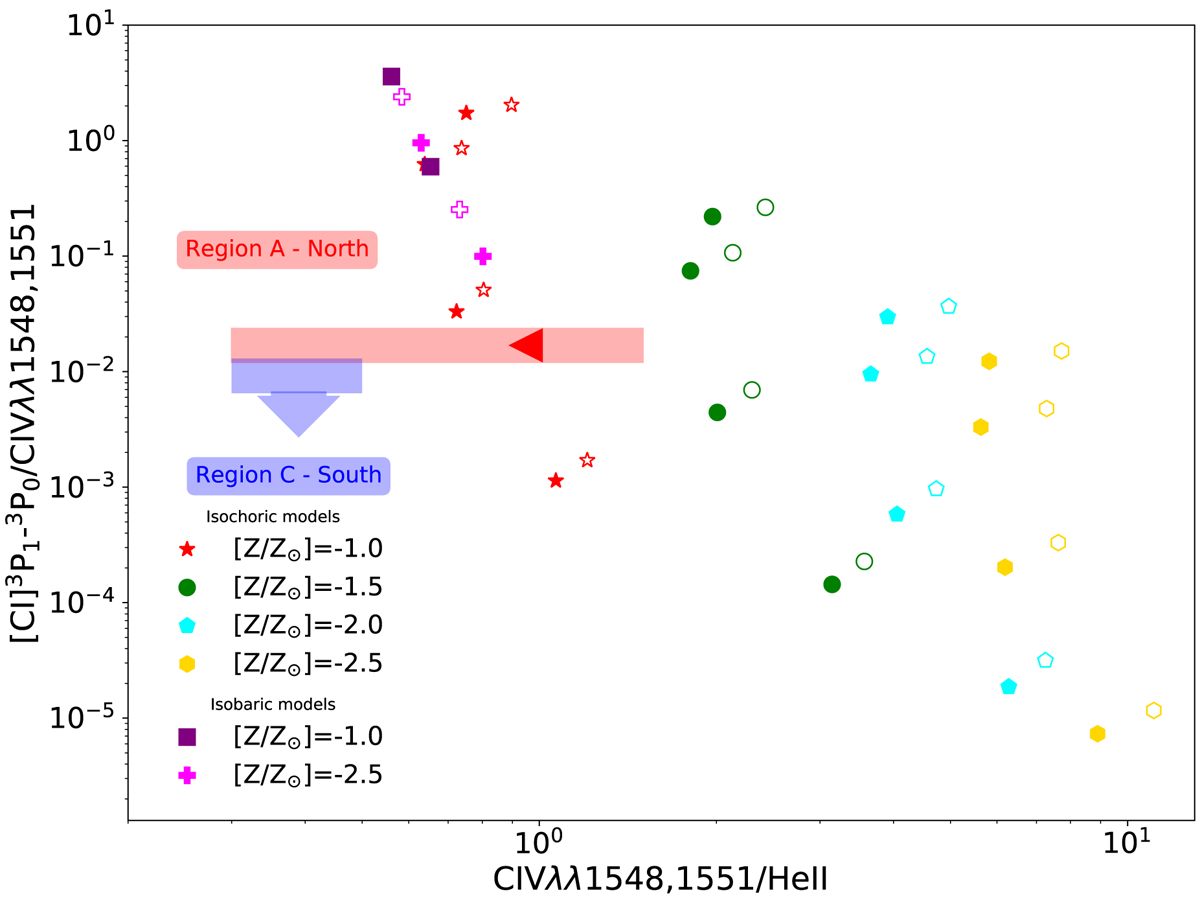
Line ratios of [C I]/C IV as a function of C IV/He II for regions A and C (using the areas shown in Fig. 2 and as labeled in the figure: red for region A and blue for region B). The colored points represent the models as indicated in the legend and are the same as in Fig. 6. We only show the region for an ionization parameter of log U = −3. The solid points indicate the ratios for a model AGN power-law ionizing spectrum with a slope of −1.5, while the hollow points show the results of a model with a power-law ionizing slope of −2.0. This is in contrast with Fig. 6, which only shows the line ratios for a model with a power-law slope of −1.0. The leftward pointing arrow represents the upper limit to the ratio of C IV/He II ≈ 1.
Current usage metrics show cumulative count of Article Views (full-text article views including HTML views, PDF and ePub downloads, according to the available data) and Abstracts Views on Vision4Press platform.
Data correspond to usage on the plateform after 2015. The current usage metrics is available 48-96 hours after online publication and is updated daily on week days.
Initial download of the metrics may take a while.