Fig. 4.
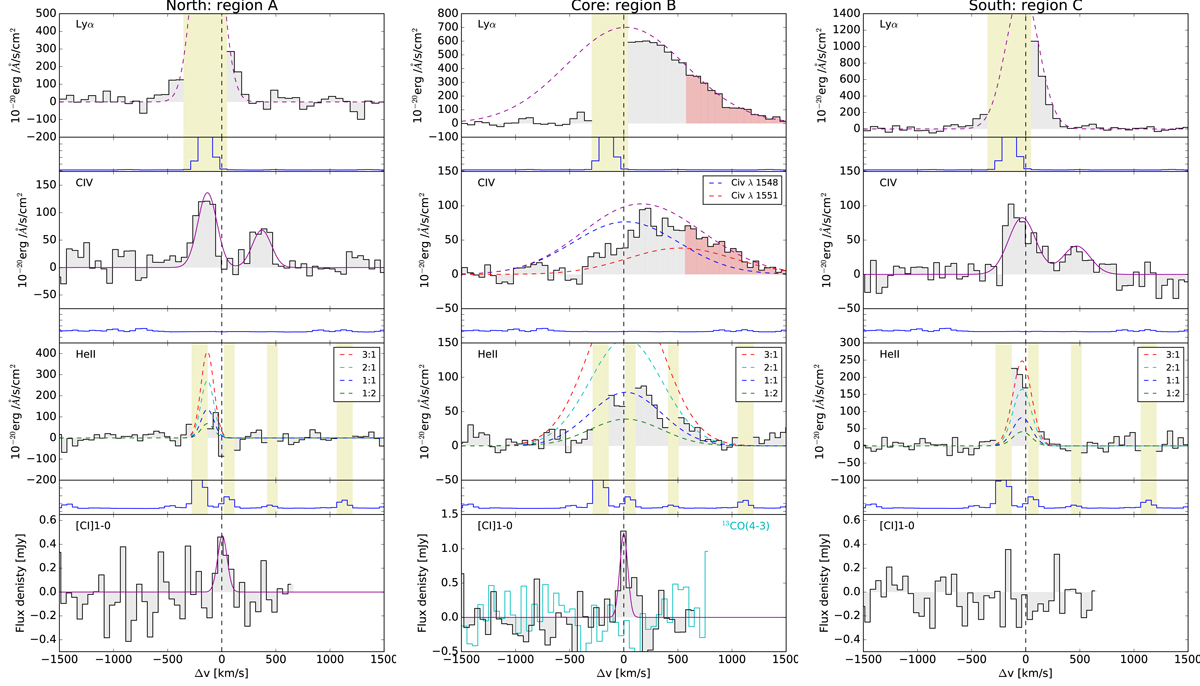
Extracted spectra of three different regions, as indicated in Fig. 3. Left to right: northern, core, and southern regions of the same emission line (which is indicated in the top left corner of each panel). Top to bottom: Lyα, C IV, and He II from the MUSE cube and [C I] from the ALMA cube for each of the three regions. The abscissa in each panel is the velocity relative to the systemic redshift in units of km s−1, estimated using the redshift of the [C I] line at the core; the dashed vertical black line indicates the systemic velocity, which is set to zero. The ordinate in each panel is the flux density in units of erg s−1 cm−2 Å−1. In the panels that show the extracted spectra around the wavelengths of the Lyα, C IV, and He II emission lines, we indicate velocity (wavelength) regions that are strongly affected night sky lines with yellow shading, and these regions are completely ignored for any fits to the line profiles. The purple lines show the best fitting line profiles, while the dashed lines indicate those fits where a significant part of the line has been ignored in constraining the fit (Sects. 3.1 and 3.2). The red shaded part of the Lyα and C IV spectrum of region B indicates the part that was used for the line fitting, and the dashed blue and red lines indicate the individual part of the C IV doublet. Most of the flux in regions A and C is lost due to the impact of the strong night sky line at 5577 Å. Dashed blue, green, cyan, and red lines indicate possible He II lines profiles, assuming that the relative velocity and FWHM are the same as that for the C IV line and have flux ratios He II/C IV of 0.5, 1, 2, and 3. The solid cyan curve in the lowest middle panel indicates the spectrum of the 13CO(4–3) line around the systemic velocity (it is a non-detection and this is simply a spectrum of the noise).
Current usage metrics show cumulative count of Article Views (full-text article views including HTML views, PDF and ePub downloads, according to the available data) and Abstracts Views on Vision4Press platform.
Data correspond to usage on the plateform after 2015. The current usage metrics is available 48-96 hours after online publication and is updated daily on week days.
Initial download of the metrics may take a while.