Fig. 3.
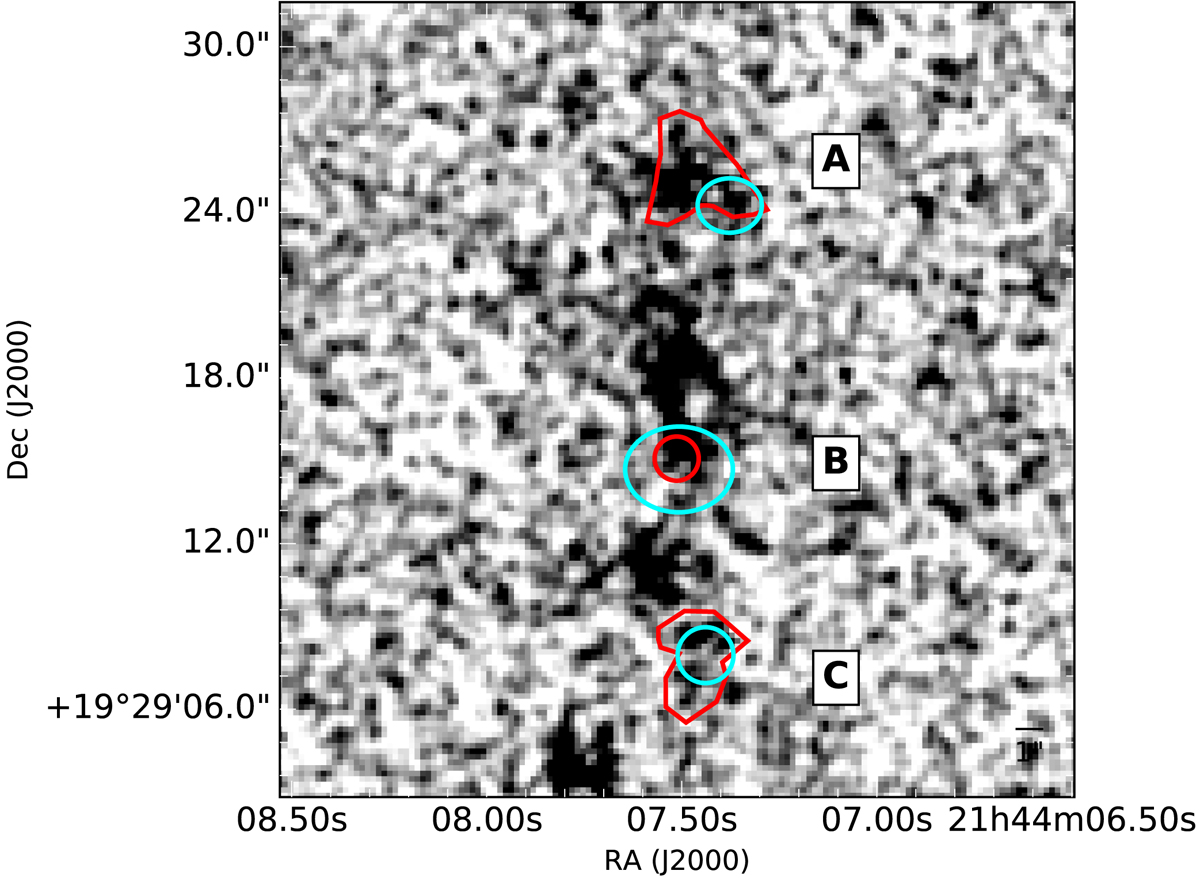
Gray-scale images of C IV emission in 4C 19.71. The regions bound by red lines are positions of the spectra extracted from the MUSE cube, determined from the C IV narrow-band image extracted from the MUSE data cube. The regions bound by cyan lines indicate the positions of the extracted [C I] spectra from the ALMA cube, defined from the [C I] moment-0 map to maximize the resulting signal-to-noise. The northern [C I] detection is unresolved; we extracted the spectrum over one beam area. The extracted spectra are shown in Fig. 4. The three main regions where the spectra are extracted are indicated by an “A” for the region north of the northern radio lobe, a “B” for the host galaxy and core where the AGN resides, and a “C” for the region south of the southern radio lobe. The regions of C IV (regions bounded by red lines) and [C I] (bounded by cyan lines) are not perfectly co-spatial in regions A and C but the C IV emission in these regions encompasses the corresponding regions of [C I] emission.
Current usage metrics show cumulative count of Article Views (full-text article views including HTML views, PDF and ePub downloads, according to the available data) and Abstracts Views on Vision4Press platform.
Data correspond to usage on the plateform after 2015. The current usage metrics is available 48-96 hours after online publication and is updated daily on week days.
Initial download of the metrics may take a while.