Fig. 2.
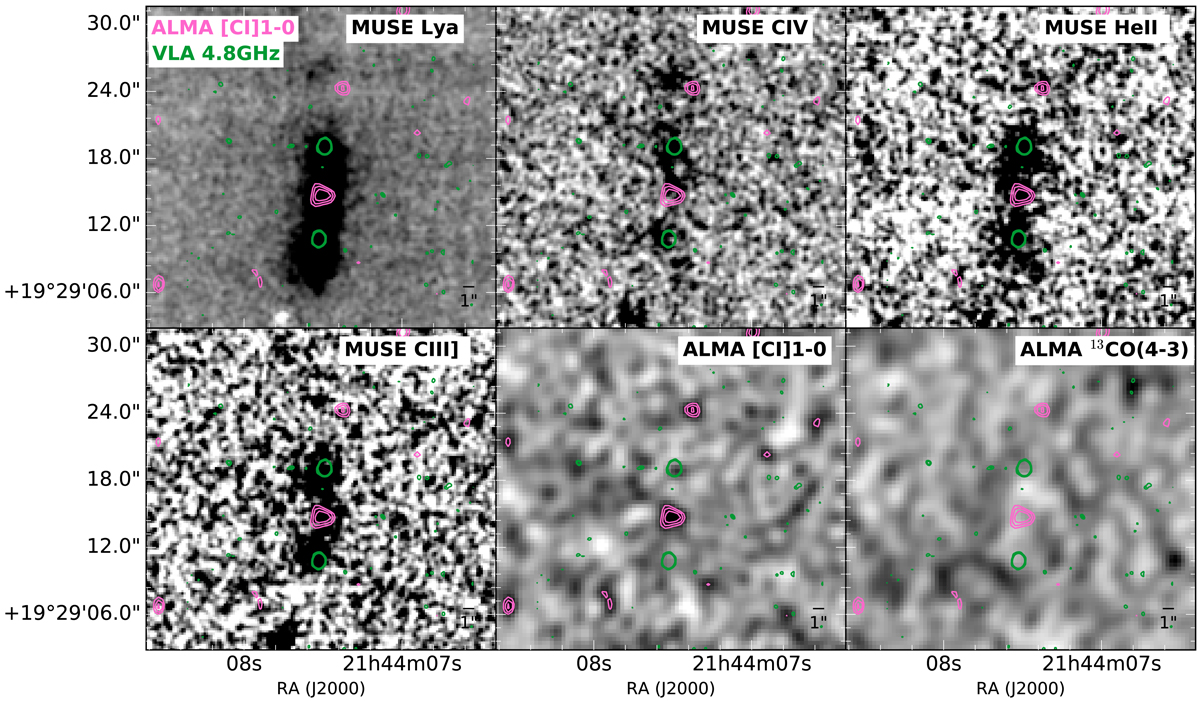
Six emission line images constructed using the MUSE and ALMA observations of 4C 19.71 (see text for details). Top left: Lyα (extracted from λobs = 5581.64−5584.14 Å); top center: C IV 1548.2 Å (extracted from λobs = 7100.39−7102.89 Å); top right: He II (extracted from λobs = 7525.39−7535.39 Å); bottom left: [C III] (extracted from λobs = 8739.14−8756.64 Å); bottom center: [C I](1–0) (extracted from 107.21−107.27 GHz) from the continuum subtracted cube; bottom right: 13CO(4–3) (extracted from 96.007−96.067 GHz) from continuum subtracted cube. MUSE moment-0 maps are smoothed with a Gaussian filter of size 7 × 7 pixels. Pink contours are overlaid [C I](1–0) line emission (levels at 2.5σ, 3σ, and 3.5σ, where σ = 29 mJy). Green contours represent the VLA band C data with levels at 3σ, ![]() ,
, ![]() , and
, and ![]() , where σ = 45 mJy. Since we did not extract the full Lyα line profile making the map due to the impact of the bright 5755 Å night sky line on the Lyα line profile, we are likely missing a significant amount of the flux and have an incomplete map of its flux distribution.
, where σ = 45 mJy. Since we did not extract the full Lyα line profile making the map due to the impact of the bright 5755 Å night sky line on the Lyα line profile, we are likely missing a significant amount of the flux and have an incomplete map of its flux distribution.
Current usage metrics show cumulative count of Article Views (full-text article views including HTML views, PDF and ePub downloads, according to the available data) and Abstracts Views on Vision4Press platform.
Data correspond to usage on the plateform after 2015. The current usage metrics is available 48-96 hours after online publication and is updated daily on week days.
Initial download of the metrics may take a while.