Fig. A.4.
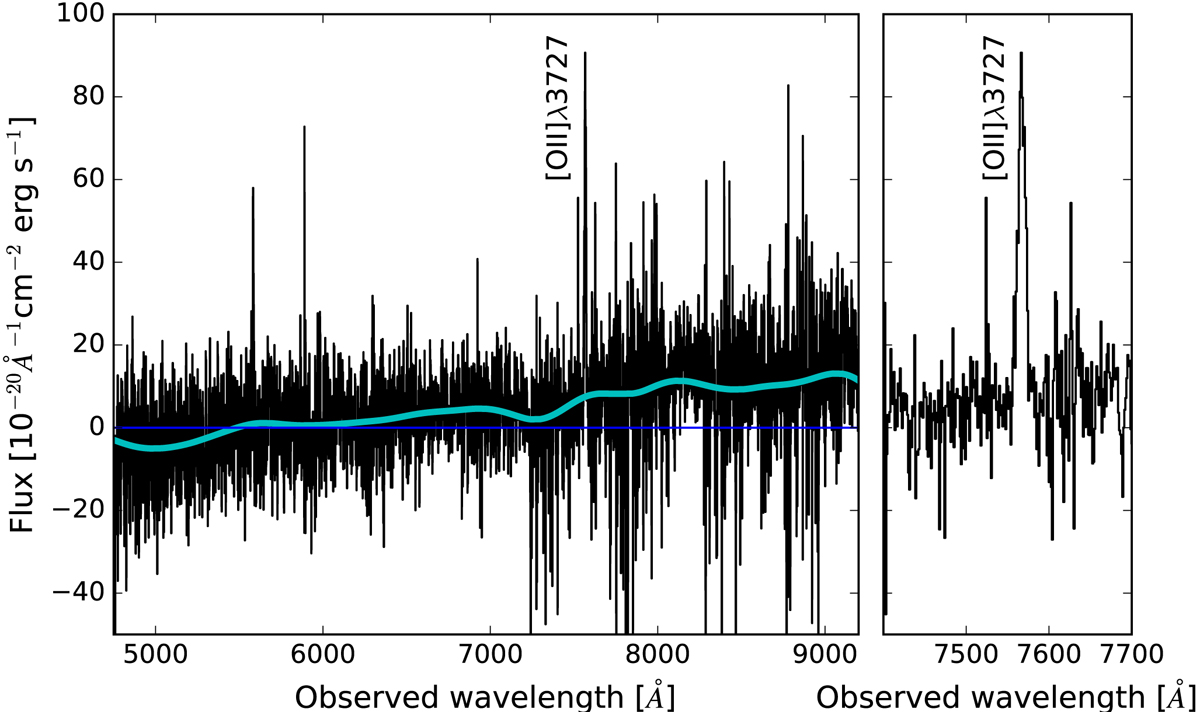
Spectrum of the foreground of Galaxy 4 at a redshift of z = 1.03. We extracted the spectrum over a circular aperture with a radius of 3 pixels. Left panel: full spectrum of the extracted region, which is contaminated with Lyα emission from 4C 19.71 at λobs ∼ 5580 Å. The cyan line shows the spectrum after it was Hanning-smoothed and the blue line indicates the zero level. Right panel: zoom-in of the line at λobs = 7567.95 Å in the spectrum of Galaxy 4. The redshift is determined as if the detection were the [O II] line. Such an identification is consistent with a continuum break observed in the spectrum. We believe this is likely the 4000 Å break, which is consistent with our line identification.
Current usage metrics show cumulative count of Article Views (full-text article views including HTML views, PDF and ePub downloads, according to the available data) and Abstracts Views on Vision4Press platform.
Data correspond to usage on the plateform after 2015. The current usage metrics is available 48-96 hours after online publication and is updated daily on week days.
Initial download of the metrics may take a while.