Fig. 6.
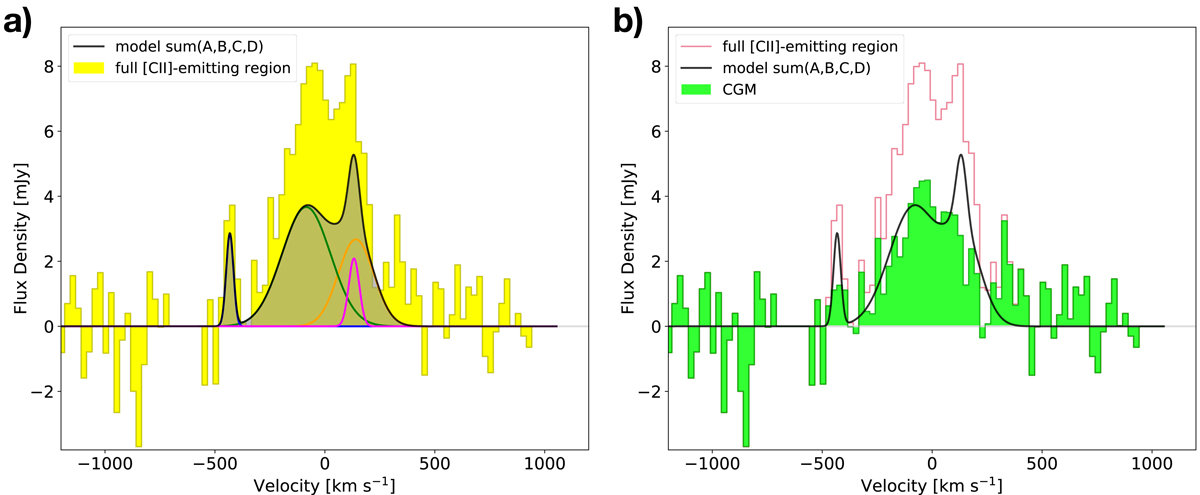
Spectrum of the total [CII] emission arising from the full system (Sect. 3.3), yellow in panel a and red in panel b, is compared with the sum (black shaded area) of the Gaussian models of individual galaxy components (coloured solid lines in panel a) and with their difference (green spectrum in panel b), corresponding to the emission arising from the circumgalactic gaseous envelope.
Current usage metrics show cumulative count of Article Views (full-text article views including HTML views, PDF and ePub downloads, according to the available data) and Abstracts Views on Vision4Press platform.
Data correspond to usage on the plateform after 2015. The current usage metrics is available 48-96 hours after online publication and is updated daily on week days.
Initial download of the metrics may take a while.