Free Access
Fig. 5.
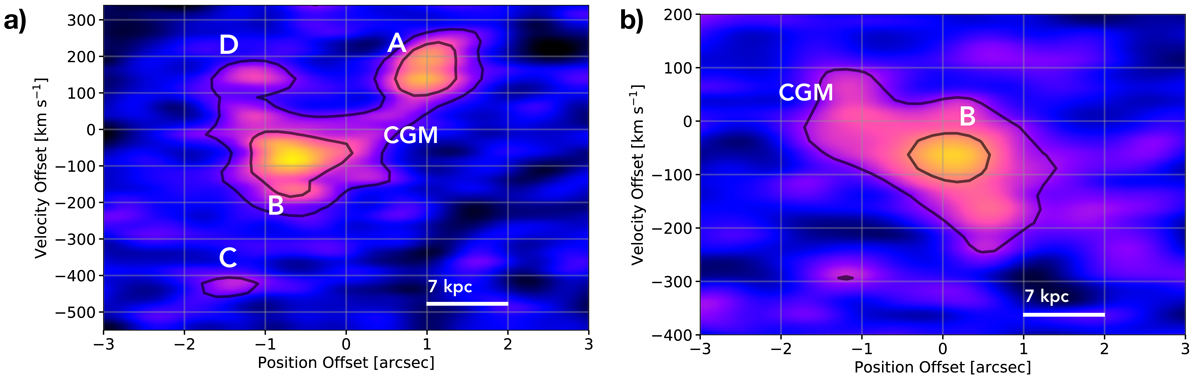
Panel a: PV diagrams taken along the common axis between the [CII]-flux centroids of #A–#B, and the orthogonal axis (panel b), with an averaging width of five pixels. Black contours indicate the [3, 6] σ significance levels, where σpv ∼ 0.3 mJy beam−1 in both cases. A scale of 7 kpc is shown in the lower right.
Current usage metrics show cumulative count of Article Views (full-text article views including HTML views, PDF and ePub downloads, according to the available data) and Abstracts Views on Vision4Press platform.
Data correspond to usage on the plateform after 2015. The current usage metrics is available 48-96 hours after online publication and is updated daily on week days.
Initial download of the metrics may take a while.