Free Access
Fig. 1.
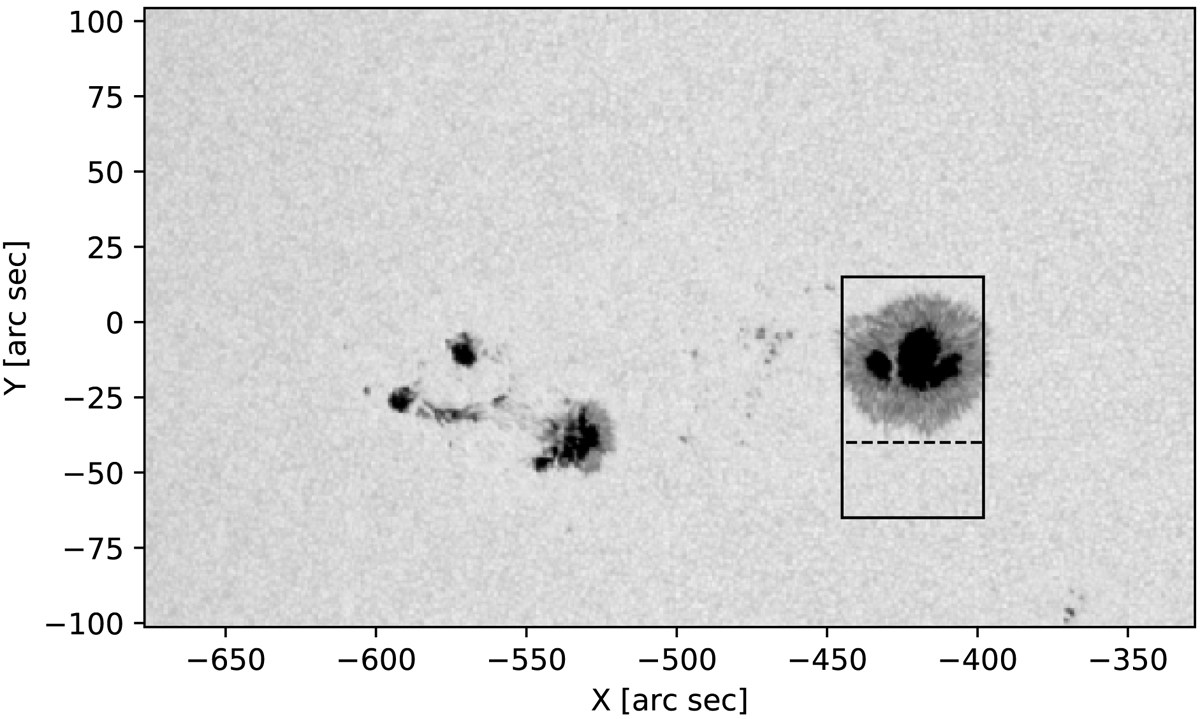
Continuum context image of active region AR12565 on July 15, 2016. Image from the HMI instrument onboard SDO (Scherrer et al. 2012). Our observations are represented by the solid rectangle in the image. The area under the dashed line corresponds to the data employed in this work.
Current usage metrics show cumulative count of Article Views (full-text article views including HTML views, PDF and ePub downloads, according to the available data) and Abstracts Views on Vision4Press platform.
Data correspond to usage on the plateform after 2015. The current usage metrics is available 48-96 hours after online publication and is updated daily on week days.
Initial download of the metrics may take a while.