Fig. 8.
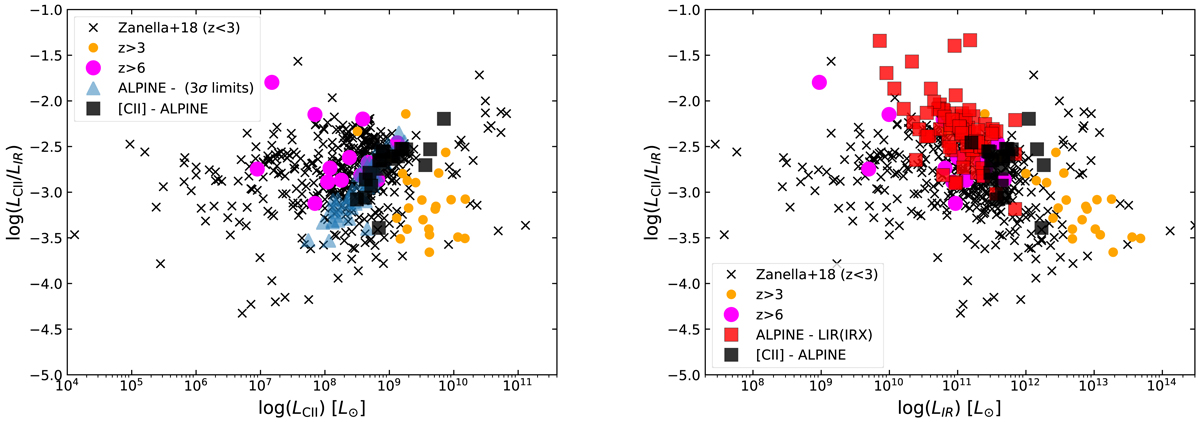
L([CII])/LIR versus L([CII]) (left panel) and LIR (right) for the ALPINE sources and comparison samples where the [C II] line is detected. For the z > 6 sources, taken from the Matthee et al. (2019) sample, we adopt Td = 45 K for the detections and LIR upper limits. For galaxies not detected in the dust-continuum, we show their L([CII])/LIR 3σ lower limit in the left panel as triangles. Right panel: LIR limits of the ALPINE sources have been replaced by the LIR values computed from the IRX–β relation, where possible.
Current usage metrics show cumulative count of Article Views (full-text article views including HTML views, PDF and ePub downloads, according to the available data) and Abstracts Views on Vision4Press platform.
Data correspond to usage on the plateform after 2015. The current usage metrics is available 48-96 hours after online publication and is updated daily on week days.
Initial download of the metrics may take a while.