Fig. 6.
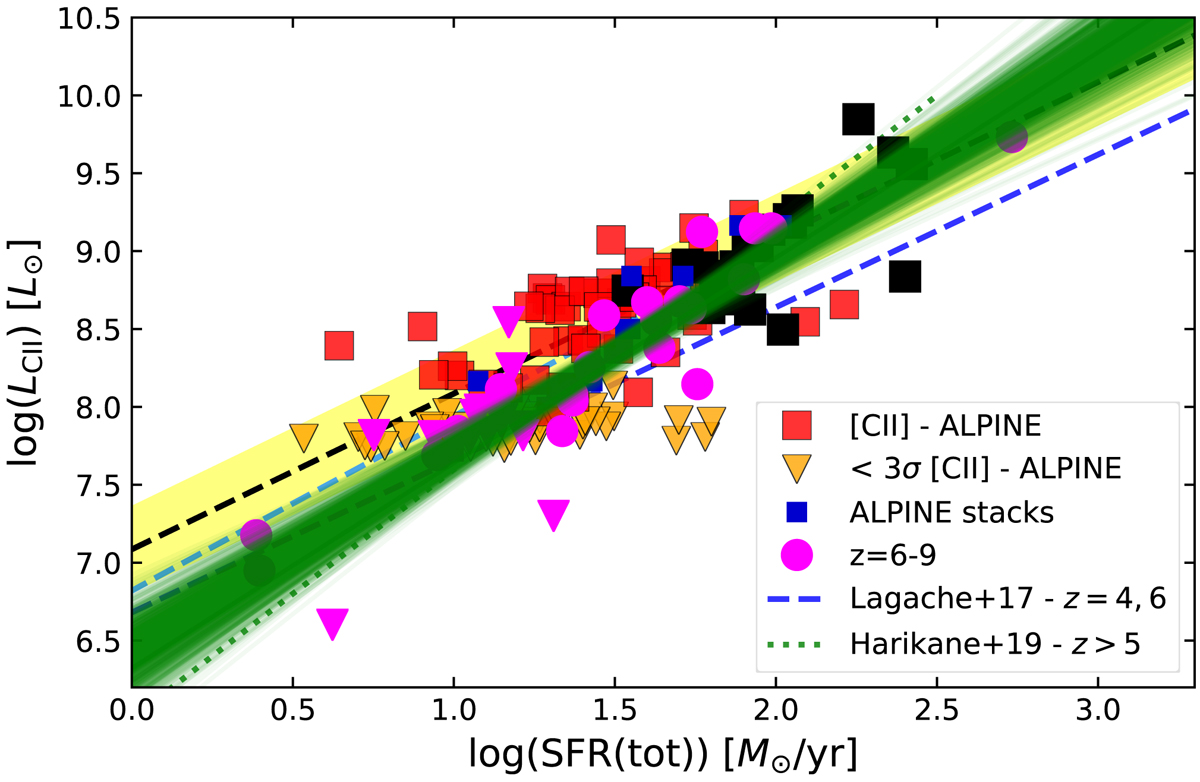
[C II]–SFR relation combining the ALPINE sample and observations of z ∼ 6 − 9 galaxies taken from the literature. The z > 6 data, after proper uniformisation, are plotted with pink symbols (circles for detections, and triangles for upper limits). The SFR of all sources includes an SFR(IR) contribution, determined from the observed dust continuum or from the IRX–β relation if undetected. All [C II] non-detections are illustrated by triangles, showing 3σ (aggressive) upper limits. The Bayesian linear fit to all the z > 4 measurements (detections and upper limits) is shown by the dark green lines/band. The slope is somewhat steeper than unity: 1.28 ± 0.10.
Current usage metrics show cumulative count of Article Views (full-text article views including HTML views, PDF and ePub downloads, according to the available data) and Abstracts Views on Vision4Press platform.
Data correspond to usage on the plateform after 2015. The current usage metrics is available 48-96 hours after online publication and is updated daily on week days.
Initial download of the metrics may take a while.