Fig. 5.
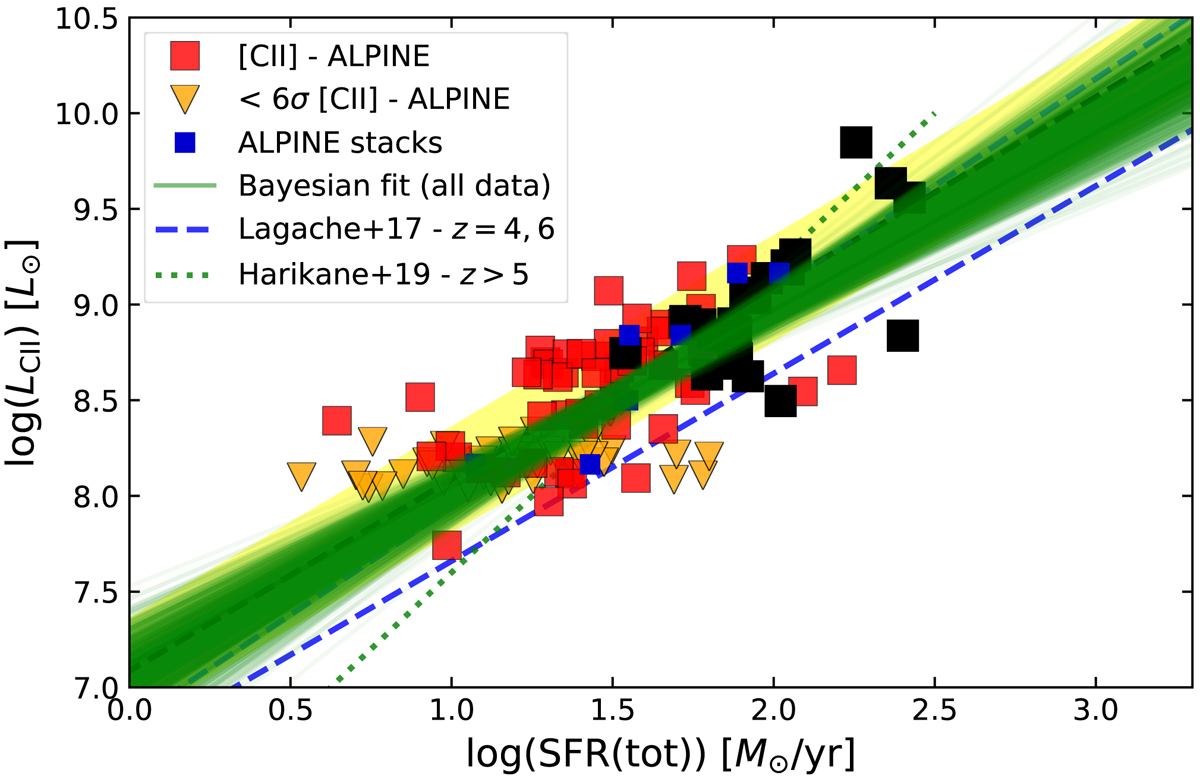
Same as Fig. 4 for ALPINE sources, but adopting conservative upper limits for the [C II] non-detections (two times the agressive 3σ upper limits). The Bayesian linear fit to all the measurements (detections and upper limits) is shown by the dark green lines/band, which also illustrates the probability distribution of the fit. The fit yields a slope of 0.96 ± 0.09, compatible with unity, and a small but insignificant offset (by ∼ − 0.03 dex) with respect to the local relation.
Current usage metrics show cumulative count of Article Views (full-text article views including HTML views, PDF and ePub downloads, according to the available data) and Abstracts Views on Vision4Press platform.
Data correspond to usage on the plateform after 2015. The current usage metrics is available 48-96 hours after online publication and is updated daily on week days.
Initial download of the metrics may take a while.