Fig. 2.
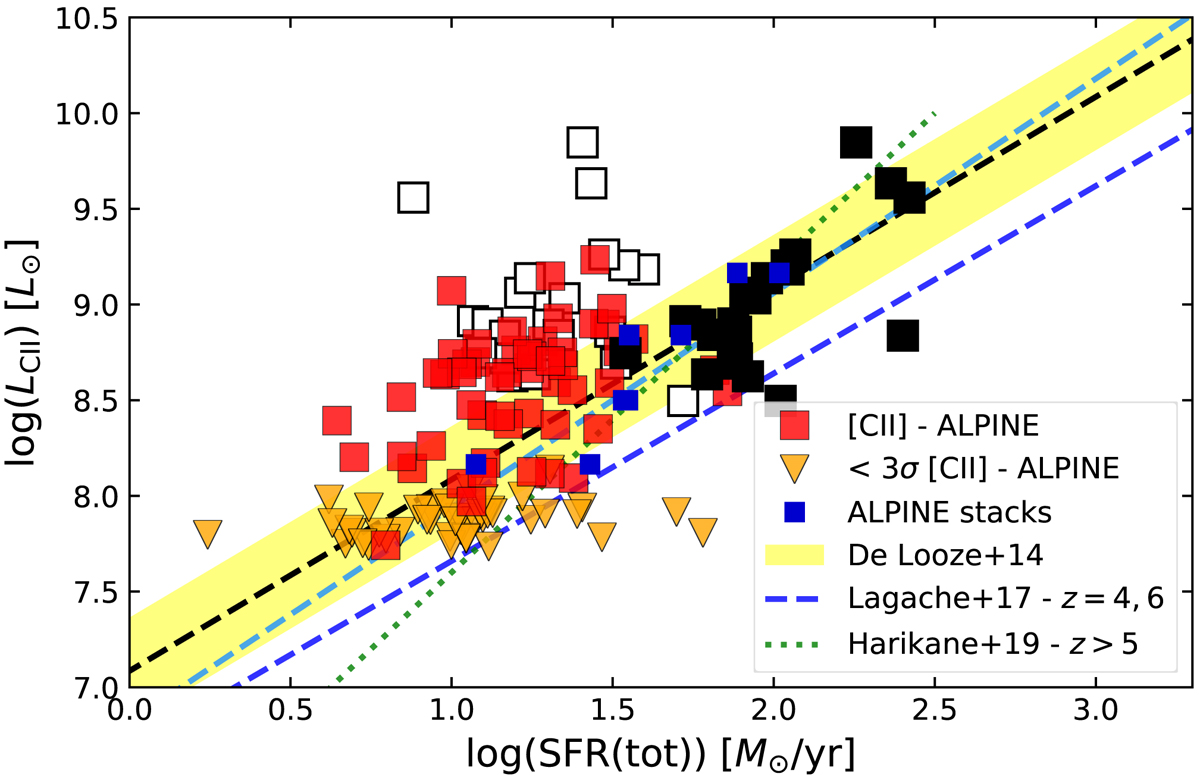
[C II] as a function of UV or UV+IR-derived SFR for the z ∼ 4.5 ALPINE sources. Squares show the [C II] detections, orange triangles the 3σ upper limits. Black squares show galaxies with continuum detection (black filled squares show SFR(UV)+SFR(IR), empty squares the SFR(UV) of the same sources); red squares shows the SFR(UV) for the other (non-continuum-detected) ALPINE sources. Blue circles show the results from stacks of ALPINE sources in four bins of L([C II]) and two redshift bins, adapted from from Bethermin et al. (2020). The observations are compared to the [C II]–SFR relations of local galaxies determined by De Looze et al. (2014) adjusted to the Chabrier IMF by reducing the SFR by a factor of 1.06 (black dashed line), shown by the yellow band with a total width corresponding to 2σ. The green dotted line shows the relation fitted to observations of z ∼ 5 − 9 galaxies by Harikane et al. (2020). The fits from the models of Lagache et al. (2018) for redshifts spanning the range of the observations are shown by the two blue dashed lines.
Current usage metrics show cumulative count of Article Views (full-text article views including HTML views, PDF and ePub downloads, according to the available data) and Abstracts Views on Vision4Press platform.
Data correspond to usage on the plateform after 2015. The current usage metrics is available 48-96 hours after online publication and is updated daily on week days.
Initial download of the metrics may take a while.