Free Access
Fig. 2.
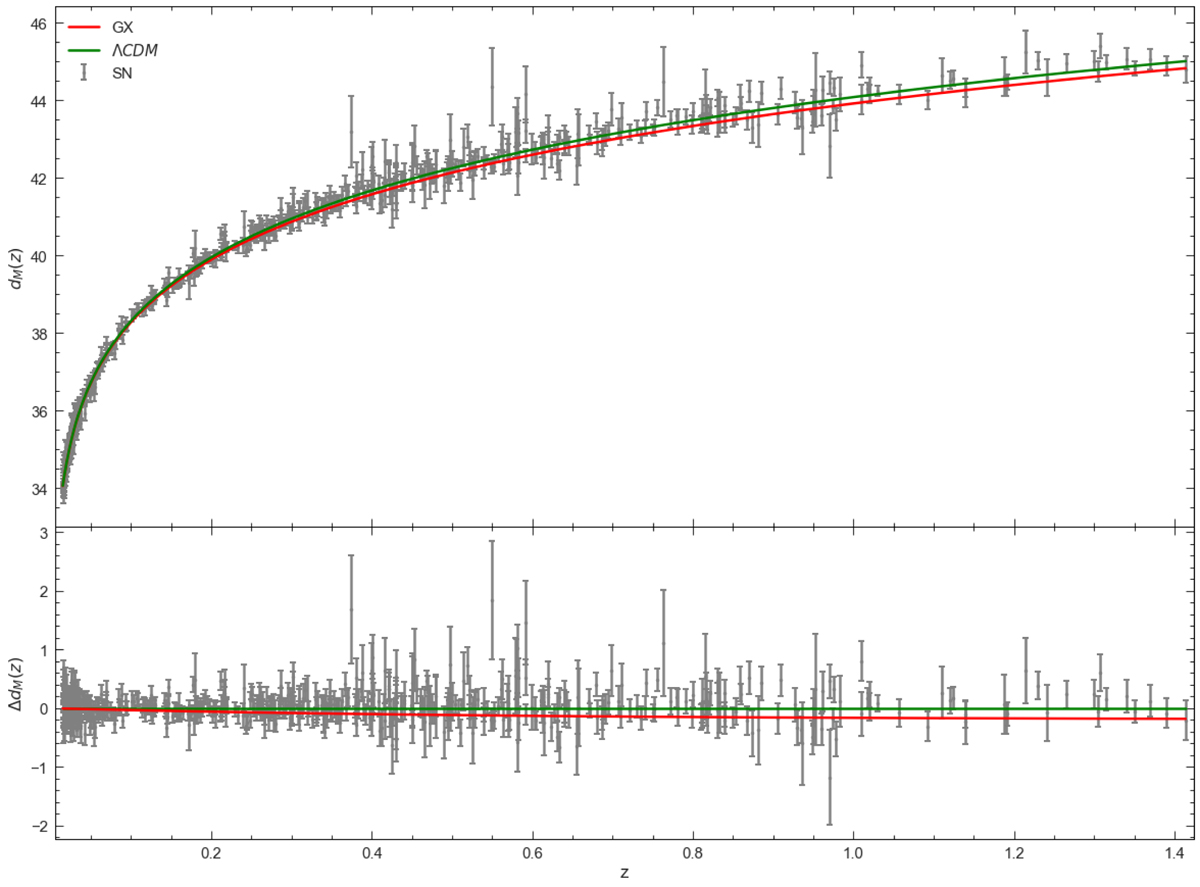
Hubble diagram for 580 SNs of the Union2.1 SN Ia sample (Amanullah et al. 2010; Suzuki et al. 2012). The red solid line represents the GX–DG cosmological model and the green solid line the ΛCDM model. The Hubble constant value is taken as H0 = 70 km s−1 Mpc−1.
Current usage metrics show cumulative count of Article Views (full-text article views including HTML views, PDF and ePub downloads, according to the available data) and Abstracts Views on Vision4Press platform.
Data correspond to usage on the plateform after 2015. The current usage metrics is available 48-96 hours after online publication and is updated daily on week days.
Initial download of the metrics may take a while.