Fig. 4
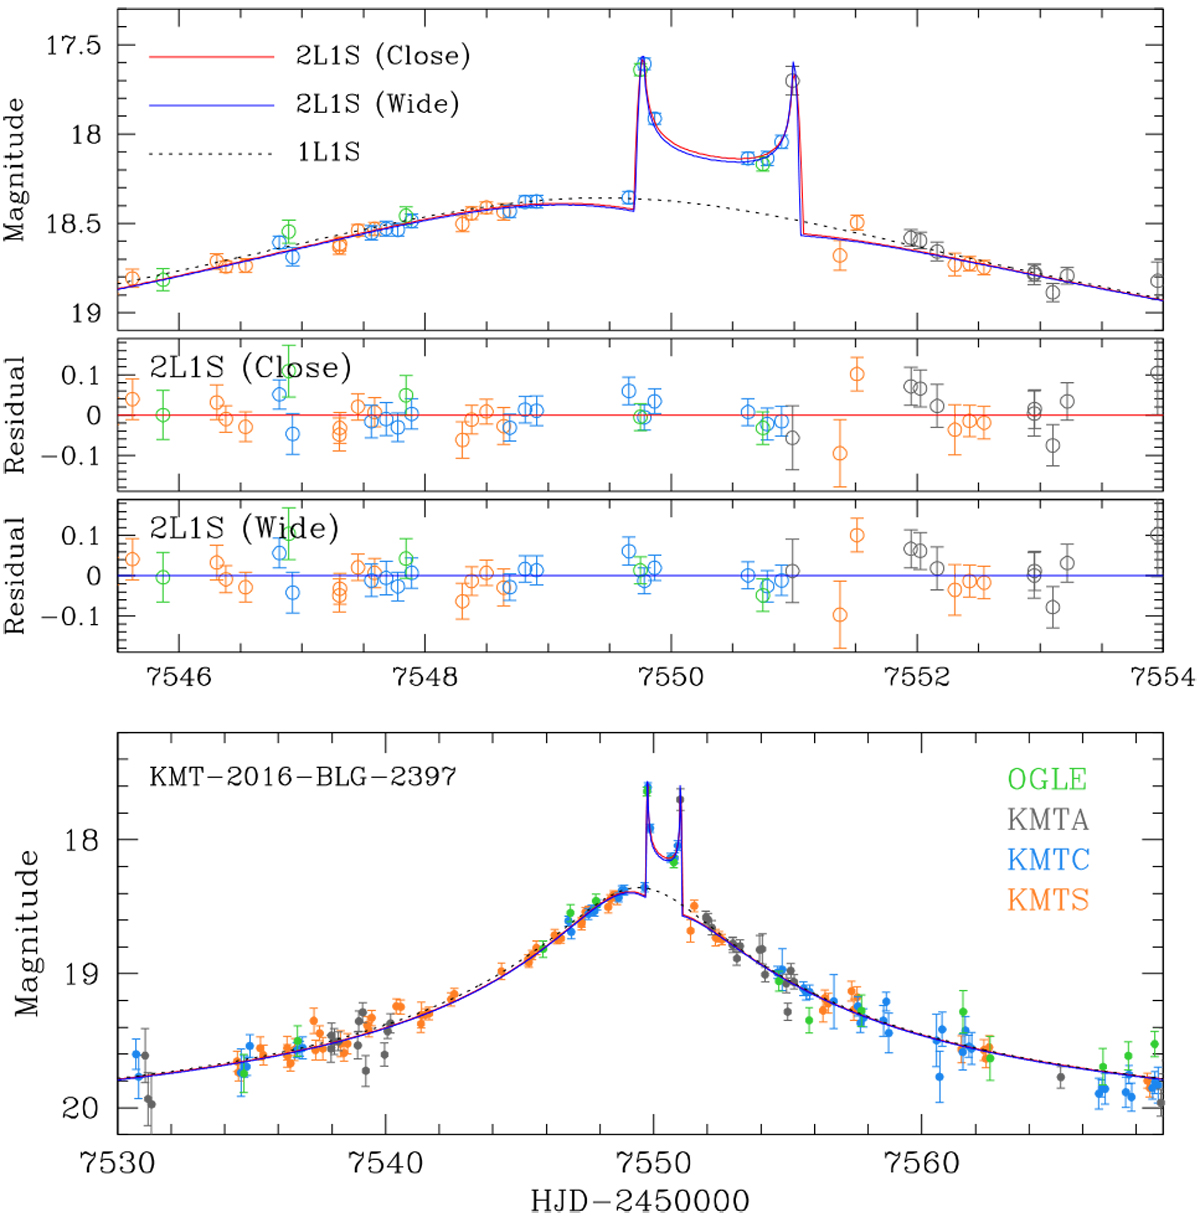
Lensing light curve of KMT-2016-BLG-2397. The dotted and solid curves are the 1L1S and 2L1S models, respectively. The enlarged view of the anomaly region is shown in the top panel. Second and third panels: residuals from the “close” and “wide” 2L1S solutions, for which the corresponding lensing parameters are presented in Table 3 and the lens system configurations are shown in Fig. 5.
Current usage metrics show cumulative count of Article Views (full-text article views including HTML views, PDF and ePub downloads, according to the available data) and Abstracts Views on Vision4Press platform.
Data correspond to usage on the plateform after 2015. The current usage metrics is available 48-96 hours after online publication and is updated daily on week days.
Initial download of the metrics may take a while.