Fig. 7
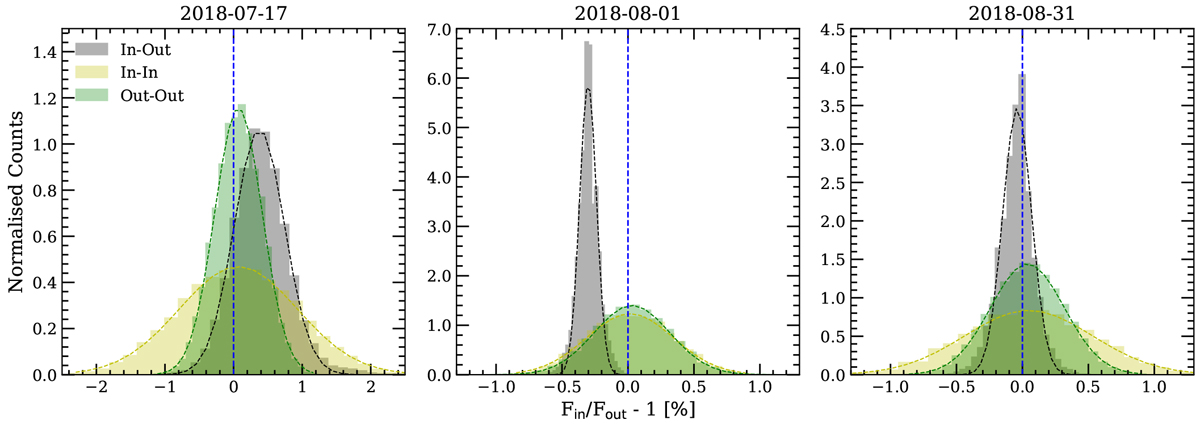
Distributions of the EMC analysis in the Hα line, using 20 000 iterations and measuring the absorption depth with a bandwidth of 0.75 Å. Each panel corresponds to the analysis of one night. In green we present the “out-out” scenario, in yellow the “in-in”, and in grey the “in-out”, which corresponds to the atmospheric absorption scenario. The blue dashed vertical line indicates the zero absorption level.
Current usage metrics show cumulative count of Article Views (full-text article views including HTML views, PDF and ePub downloads, according to the available data) and Abstracts Views on Vision4Press platform.
Data correspond to usage on the plateform after 2015. The current usage metrics is available 48-96 hours after online publication and is updated daily on week days.
Initial download of the metrics may take a while.